
Preface
This third installment of our analytical series continues to unravel the complex tapestry of global power dynamics through the intertwined lenses of geopolitics and geoeconomics. While earlier contributions, notably “Back to Center Stage – China Resurgence,” examined China’s grand strategy in the context of historical continuity and cultural identity, this article shifts to a more technical perspective, dissecting the intricate macroeconomic and structural forces shaping China’s contemporary trajectory.
At the heart of our analysis lies the pivotal concept of “dual circulation,” emblematic of China’s aspiration to strengthen domestic economic resilience while maintaining strategic international engagement. This dual approach underscores a modern geopolitical landscape where economic efficiency, technological prowess, and security concerns are closely interwoven. By meticulously exploring China’s internal structural tensions—ranging from demographic challenges and state-market interactions to intricate global value chain dynamics—we elucidate the profound complexities underlying China’s ambitious strategic objectives.
Recognizing China’s remarkable capacity for rapid adaptation, innovation, and resilience, our assessment carefully balances acknowledgment of these impressive advancements with a clear-eyed examination of enduring challenges. Eschewing premature conclusions, this work highlights the subtle interplay between internal policy decisions and external geopolitical pressures, fostering a nuanced appreciation of China’s evolving economic landscape. Ultimately, this balanced approach aims to deepen understanding of China’s systemic rebalancing efforts and its pivotal role in reshaping global affairs in the coming decade.
1. The Core Paradox: An Unbalanced Engine Despite Decades of Growth
Why does China’s formidable economic engine, even after navigating the significant global disruption of the 2008 Global Financial Crisis (GFC) and achieving decades of unparalleled expansion, remain fundamentally unbalanced in its core structure?
This central question confronts analysts and policymakers alike. Despite recurrent official pronouncements and strategic plans prioritizing a shift towards domestic demand, China’s economic trajectory reveals a persistent and increasingly problematic paradox: its growth continues to lean heavily on exceptionally high rates of investment and the corresponding necessity of exporting surplus national savings, rather than drawing sustainable momentum from robust household consumption typical of maturing economies. This deep-seated structural imbalance, a legacy of its development model, represents a critical vulnerability and the central challenge in its quest for sustainable, high-quality growth within a more contested global environment.
The persistence of this imbalance post-GFC is particularly telling. Macroeconomic data starkly illustrate that household consumption as a share of China’s Gross Domestic Product (GDP) has shown limited upward momentum, often hovering in the 38-40% range. This figure stands in sharp contrast to international norms and even many peer nations at similar income levels, indicating a structural deviation.
Data Box 1.1: China’s Household Consumption Share – A Persistent Outlier (1980-2023)
A key indicator of China’s structural imbalance is its persistently low share of household consumption in Gross Domestic Product (GDP). This metric not only deviates from developed economies but also from the typical trajectories observed in other rapidly industrializing East Asian economies over an extended period. The analysis now incorporates data from 1980 to 2023, providing a richer historical context.
- China’s Trajectory (1980-2023): Examining the longer time series, China’s household consumption started at higher levels (e.g., often above 50% in the early 1980s) before experiencing a significant decline during the subsequent decades of accelerated investment-led growth, reaching a trough of around 34-35% by 2010. Since then, there has been a slow and partial recovery, with the share hovering in the 38-40% range in the years leading up to and including 2023.
- International Comparisons (1980-2023):
- OECD Average: Developed economies within the OECD typically exhibit household consumption shares consistently around 60% of GDP over this extended period.
- Japan: Over the 1980-2023 period, Japan’s household consumption share, while fluctuating, has generally remained significantly higher than China’s trough, typically in the 55-60% range, reflecting its status as a mature economy.
- South Korea: South Korea’s trajectory since 1980 shows a consumption share that, while experiencing its own shifts during rapid industrialization, has generally been consistently higher than China’s recent levels, often in the 45-55% range.
- Other Comparator Countries (as per user’s dataset): The inclusion of other countries like the USA, Germany, and France over the 1980-2023 period further underscores the differing structural compositions of these economies compared to China.
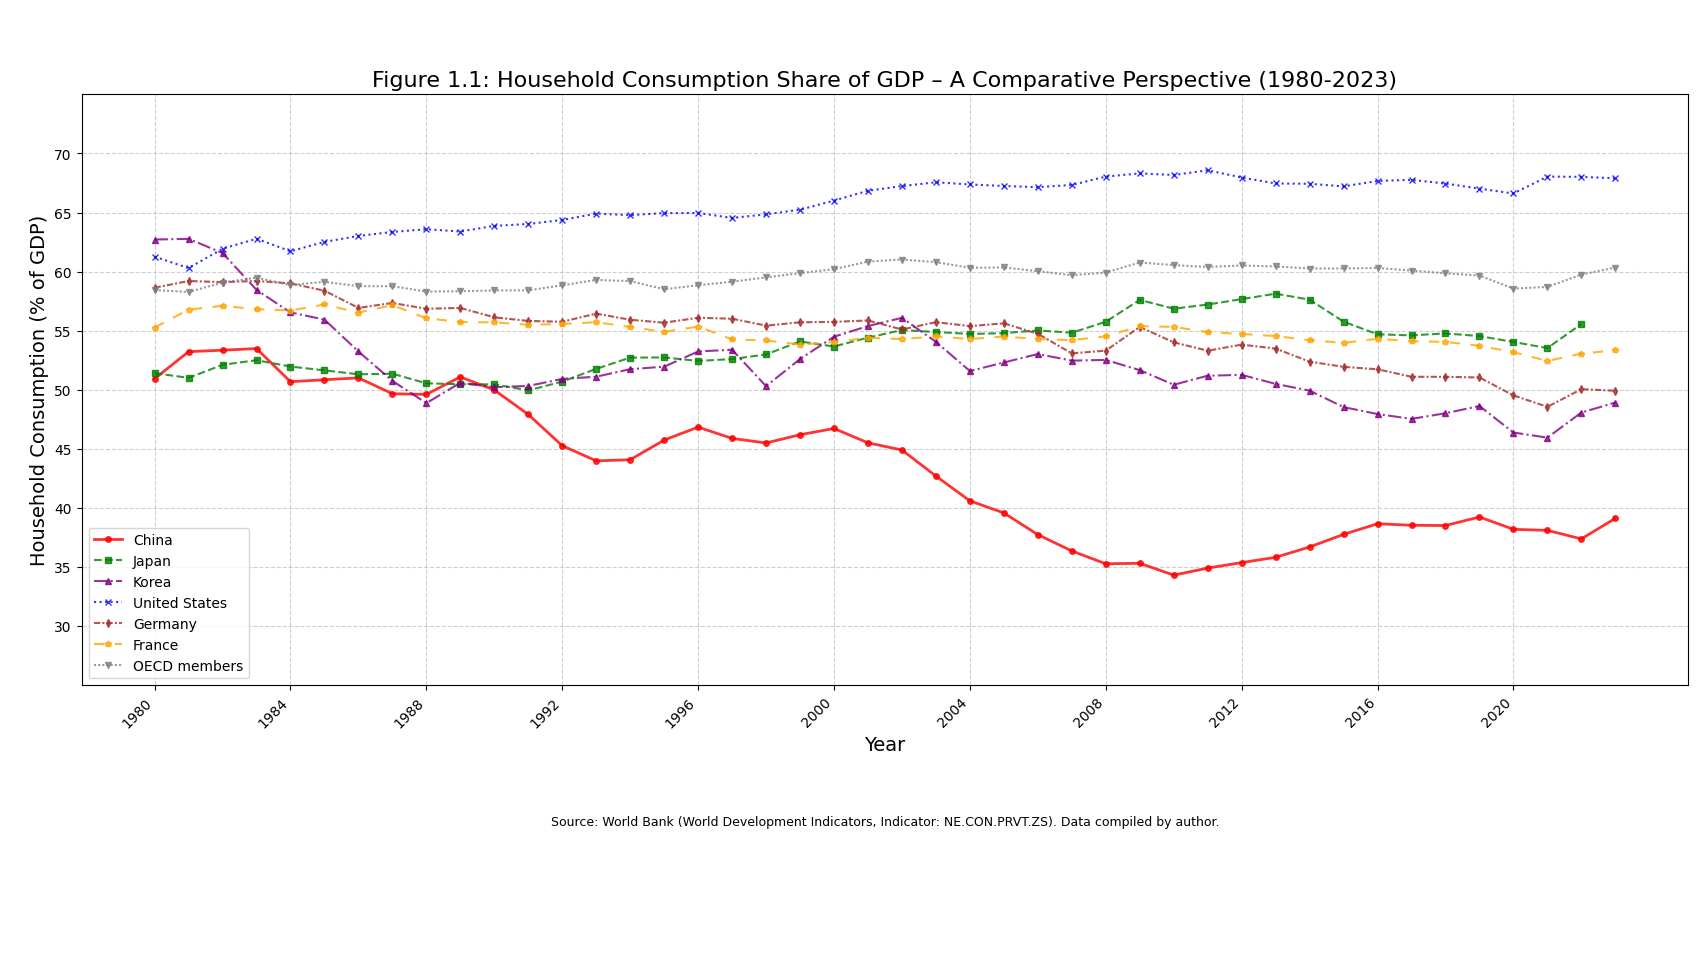
China’s household consumption trajectory over the extended 1980-2023 period presents a significant deviation from typical economic development paths, where consumption’s share of GDP often stabilizes or rises as national income increases and economies mature. The initial higher share in the early 1980s, followed by a decline during its period of fastest growth and the subsequent limited recovery, underscores the depth of structural factors (such as a low household share of national income, high precautionary savings due to incomplete social safety nets, and the burden of housing costs) that suppress domestic private demand. This quantitatively establishes the “low” consumption base and highlights the scale of the rebalancing challenge China faces in shifting towards a more internally driven and sustainable growth model. The persistence of this low share, despite rising absolute consumption, indicates that the benefits of GDP growth have not proportionally translated into household spending power to the same extent as in many comparator economies.
Concurrently, Gross Capital Formation (investment) has consistently absorbed an extraordinarily high share of national output, remaining above 40% for most of the post-2008 period. Such elevated investment rates, while historically instrumental in building foundational infrastructure and industrial capacity during early stages of development, inherently become less sustainable and efficient as an economy matures, signaling potential resource misallocation and diminishing returns. This theme of declining investment efficiency will be explored further (Chapter 3).
Data Box 1.2: China’s Investment Reliance – An Enduring Outlier
Complementing its low household consumption share, China’s reliance on Gross Capital Formation (GCF), or investment, as a percentage of GDP has been exceptionally high and sustained, particularly since the 2008 Global Financial Crisis. This distinguishes China significantly from most major developed and many emerging economies, where investment shares are typically lower or have declined as economies mature.
- China’s Investment Trajectory: China’s GCF as a share of GDP surged dramatically in the 2000s, from around 34% in 2000 to a peak near 47% of GDP around 2009-2011 in the wake of the massive post-GFC stimulus. Since then, it has remained extraordinarily high, generally fluctuating between 42% and 43% of GDP through 2023.
- International Comparisons:
- OECD Average: The average GCF for OECD countries typically ranges between 20% and 25% of GDP.
- United States: The US investment share has generally been lower, often fluctuating between 18% and 23% of GDP.
- Japan: After its high-growth, high-investment phase ended, Japan’s GCF share has typically been in the 23-30% range.
- South Korea: During its rapid industrialization, South Korea saw high investment rates (sometimes exceeding 35%), but these moderated as its economy matured, with recent figures often in the 30-33% range.

China’s sustained high rate of Gross Capital Formation is a defining feature of its economic model. While crucial for early industrialization, maintaining such levels as an economy matures points to an enduring reliance on capital accumulation to drive headline GDP growth, contrasting with more balanced economies. The persistence of this high investment rate, even as returns diminish (discussed in Chapter 3), underscores the structural challenges in shifting towards a more consumption-driven and efficient growth path.
China’s prevailing economic structure—marked by a low household consumption share of national income alongside persistently high investment levels—necessarily translates into an exceptionally high National Savings rate. National Savings, defined as the portion of total GDP not consumed by households or the government, is thus correspondingly large. This high aggregate saving, which includes contributions from households, corporations (notably retained SOE earnings), and the government sector, provides the domestic financial resources fueling the high rate of investment and contributing to external imbalances.
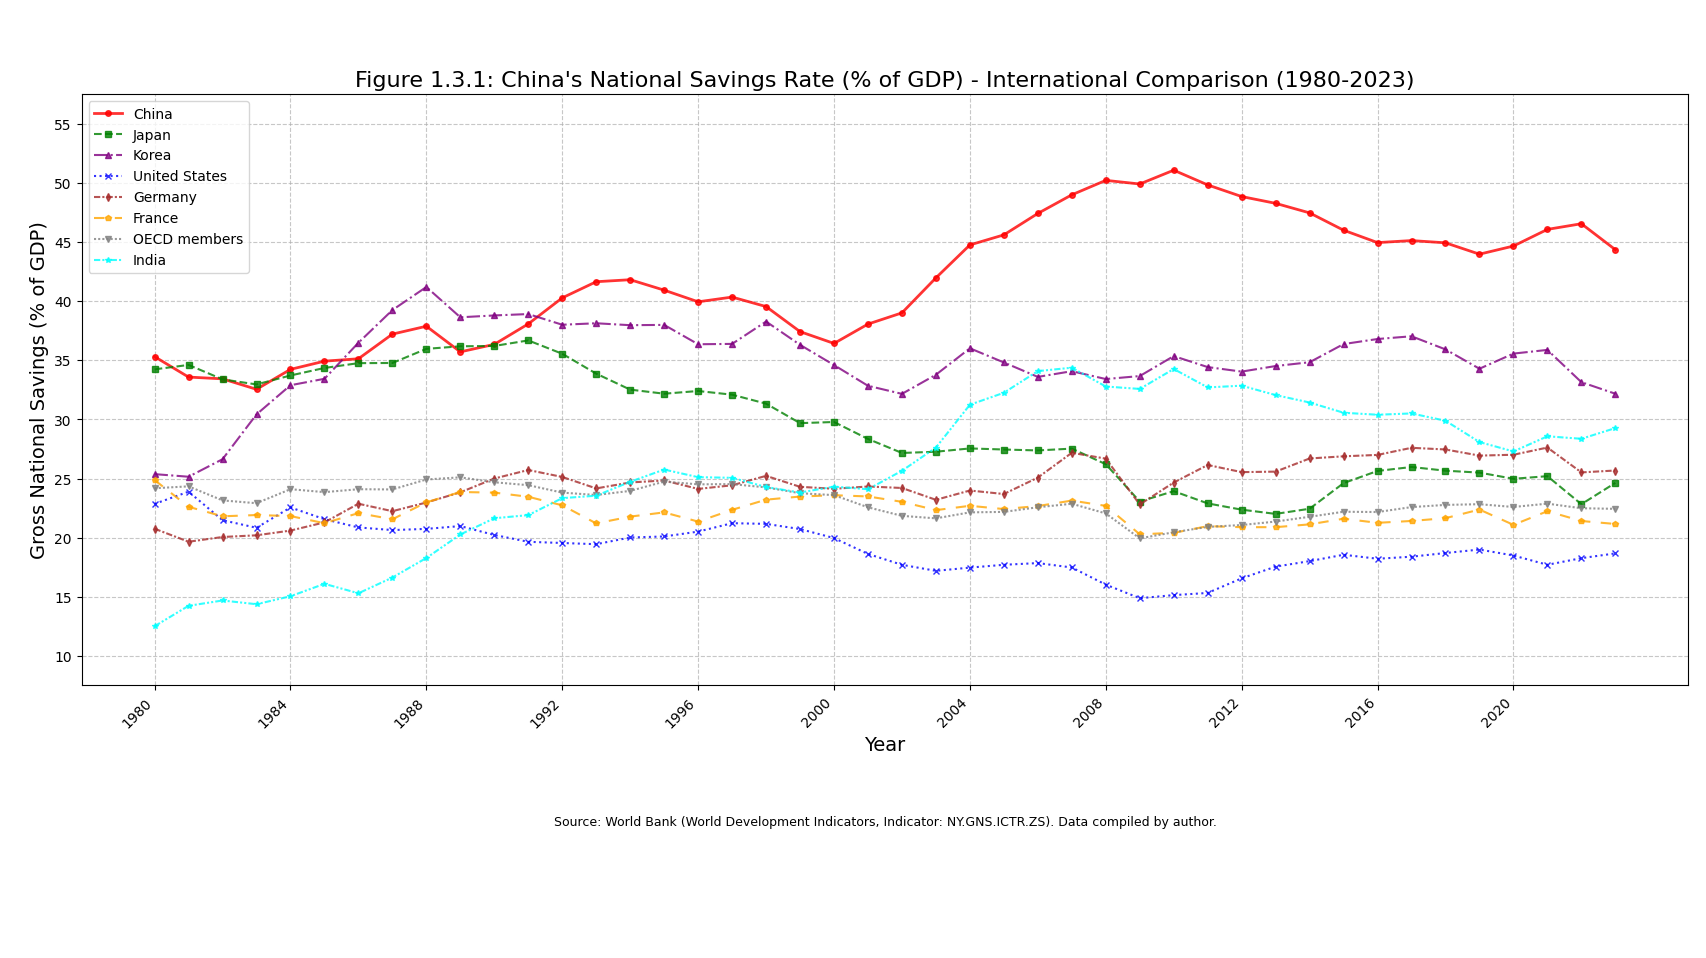
Data Box 1.3: China’s High National Savings Rate – Level, Composition, and International Context
China’s exceptionally high Gross National Savings (GNS) rate is central to its investment-driven growth model and external economic imbalances. Understanding this high savings rate involves examining both its composition within China and its context relative to international benchmarks.
1. Components of National Savings
Gross National Savings (GNS) is total national income (GDP plus net income from abroad) minus household and government consumption. It comprises savings from three main sectors:
- Household Savings: Disposable income minus consumption, influenced by precautionary motives, demographics, housing markets, and credit access.
- Corporate Savings (Non-financial and Financial): Mainly retained earnings, notably from State-Owned Enterprises (SOEs), which often reinvest profits rather than distribute dividends.
- Government Savings: Government revenue minus current consumption expenditure, excluding capital spending.
2. China’s National Savings Rate: International Perspective
Historically, China’s GNS has been remarkably high, increasing from about 35-40% of GDP in the 1980s to over 50% around 2008, then moderating slightly (around 44% in 2023). This consistently surpasses rates in OECD countries and other major economies, highlighting China’s distinctive savings intensity.
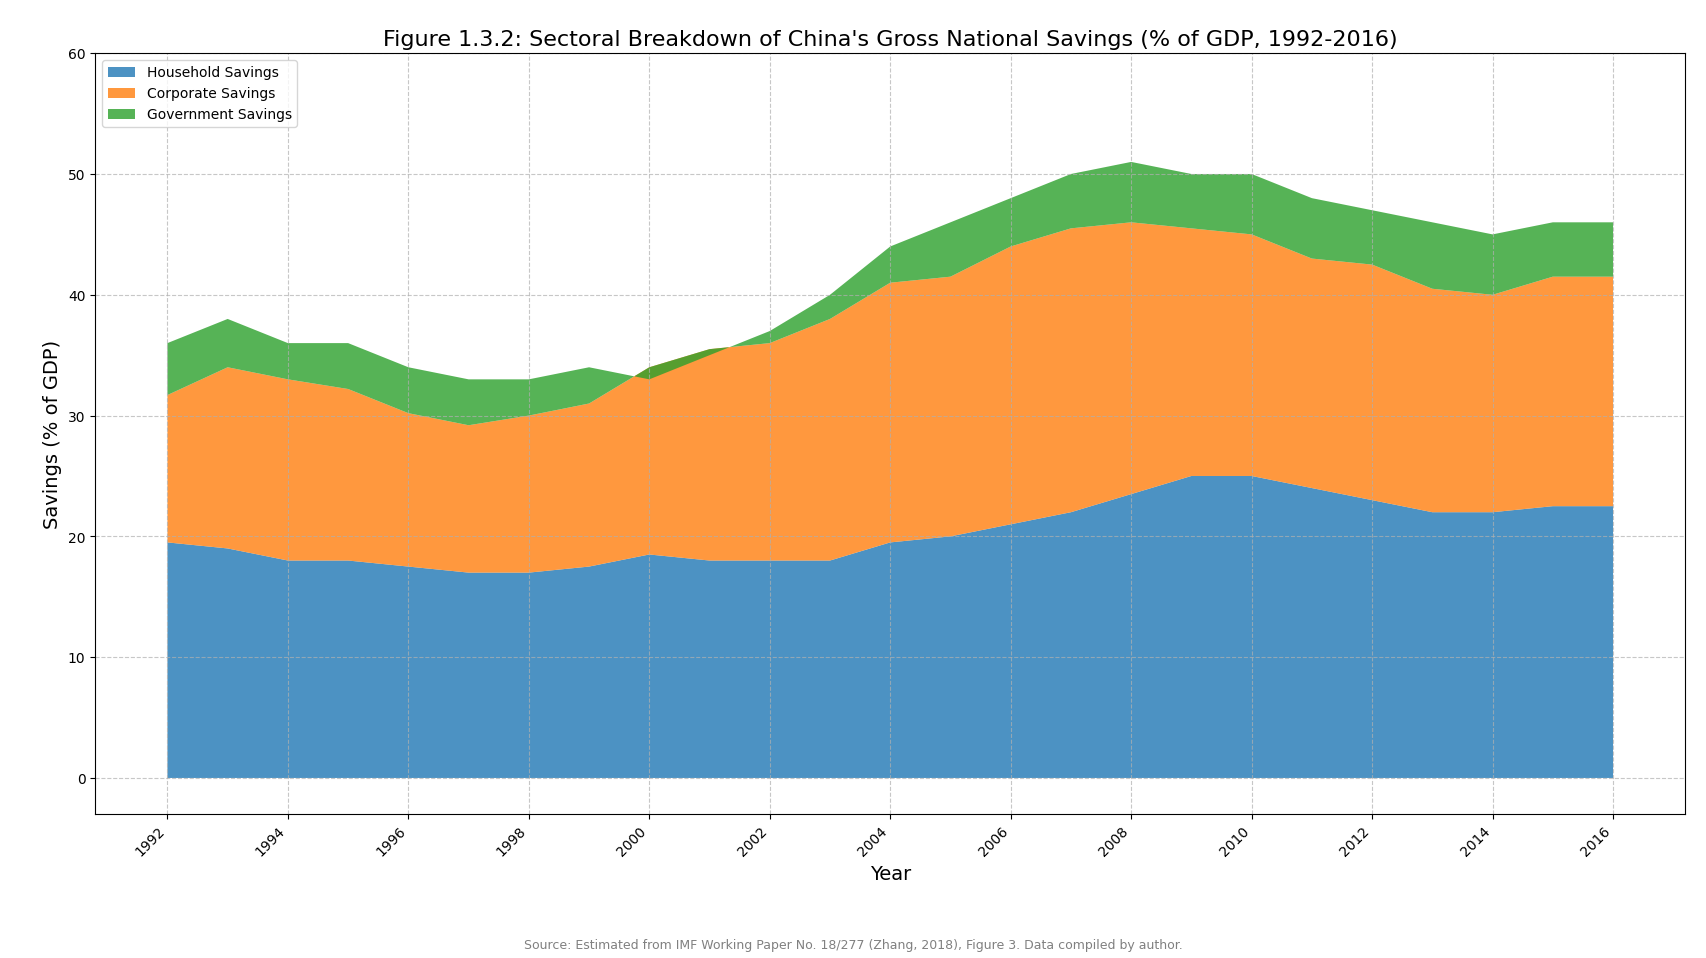
3. Sectoral Contributions within China
From 1992 to 2016, China’s high national savings was driven concurrently by significant contributions from households, corporations, and the government:
- Households: Savings remained robust, rising from 19.5% of GDP in 1992 to a peak around 25% in 2009-2010, settling near 22.5% by 2016. High household savings reflect strong precautionary saving incentives.
- Corporations: Corporate savings became increasingly dominant, climbing from 12.5% of GDP in 1992 to a peak of 23.5% in 2007, moderating to around 19% by 2016. This reflects periods of high profitability, especially among SOEs, and retention-focused policies.
- Government: Government savings, though volatile, typically contributed positively (3-5% of GDP), reflecting revenue growth and fiscal policy emphasizing investment over consumption.
4. China’s Savings in International Context
- Household Savings: China’s household savings (around 23% of GDP mid-2010s) greatly exceed global averages (~8%), highlighting its unique precautionary motives and structural drivers.
- Corporate Savings: Reflecting a global upward trend, China’s corporate saving rate surged significantly, becoming a key national savings component. Though moderating, it remains above the global average.
- Government Savings: Often above global averages, China’s government savings reflect a prioritization of capital investment over current consumption and extensive social transfers, indirectly influencing household saving behavior.
Distinctive Features and Implications:
China’s “all-sector high saving” scenario—where households, corporations, and the government simultaneously contribute significantly—is unique. This arises from the structurally low share of household income in GDP, enabling considerable corporate and government income retention, both sectors exhibiting high saving propensities.
Consequently:
- China’s national savings substantially finance its sustained investment boom.
- Consumption remains suppressed due to income distribution skew and precautionary saving.
- Allocation of substantial corporate and government savings is heavily state-influenced, directed towards strategic sectors and infrastructure, impacting capital allocation efficiency and investment productivity.
Addressing China’s economic rebalancing requires structural shifts: increasing households’ income share, enhancing social safety nets to reduce precautionary savings, and adjusting corporate and government saving-investment behaviors. China’s persistent multi-sectoral high-saving pattern underscores the deep-rooted structural challenges facing its economic transformation.
To understand how this internal configuration of high savings and high investment plays out externally, we turn to the fundamental macroeconomic identity: National Savings (S) minus Domestic Investment (I) equals the Current Account Balance (S - I = CAB).
Definition Box 1.1: The S-I = CAB Identity (The Savings-Investment and Current Account Balance Relationship)
In national income accounting, a country’s total output (Gross Domestic Product, or GDP, denoted as Y) can be expressed as the sum of its expenditures: Household Consumption (C), Government Consumption (G), Investment (I), and Net Exports (Exports (X) minus Imports (M)). Thus, Y = C + G + I + (X - M).
National Savings (S) is defined as the portion of national income (Y) that is not used for current consumption by either households (C) or the government (G). Therefore, S = Y - C - G.
By substituting the expenditure definition of Y into the savings equation, we get:
S = (C + G + I + X - M) - C - G
This simplifies to:
S = I + (X - M)
Rearranging this equation yields the crucial identity:
S - I = X - M
Here, (X - M) represents the Trade Balance (the balance of trade in goods and services). When net income from abroad (such as investment income) and net current transfers are also included, this becomes the Current Account Balance (CAB). For conceptual clarity, the CAB broadly reflects the outcome of the savings-investment balance.
Implication for External Balances:
If a country’s National Savings (S) exceed its Domestic Investment (I), it means the nation saves more than it invests within its own borders (S > I). This condition necessitates that (X – M) must also be positive.
- Excess Savings Flow Abroad: The surplus domestic savings (
S - I) are channeled internationally, making the country a net lender to, or net investor in, the rest of the world. This outflow of financial capital signifies the country acquiring foreign assets. - Mirrored in Trade: For this net financial outflow to occur, the country must, on balance, be exporting more goods and services than it is importing. Its exports (X) must exceed its imports (M), resulting in a trade surplus, which is the primary component of a current account surplus. In essence, a current account surplus indicates a country is a net exporter of capital, which is only possible if it also exports more goods and services than it imports. The excess of savings over domestic investment provides the financial resources for this net export of capital, mirrored by a net export of goods and services. Conversely, if I > S, the country must import capital, reflected in a current account deficit (M > X).
Given that China’s aggregate national savings persistently exceed even its substantial domestic investment requirements (S > I), the nation must export this surplus capital. This manifests as a persistent Current Account Surplus. While the surplus’s relative size (as % of GDP) declined from its pre-GFC peak (near 10%) to typically fluctuate between 1-3% post-2010 (with notable post-COVID spikes), its stubborn persistence, particularly its often large absolute value (running into hundreds of billions of USD annually), signals unequivocally that the core internal rebalancing towards consumption has fundamentally stalled.
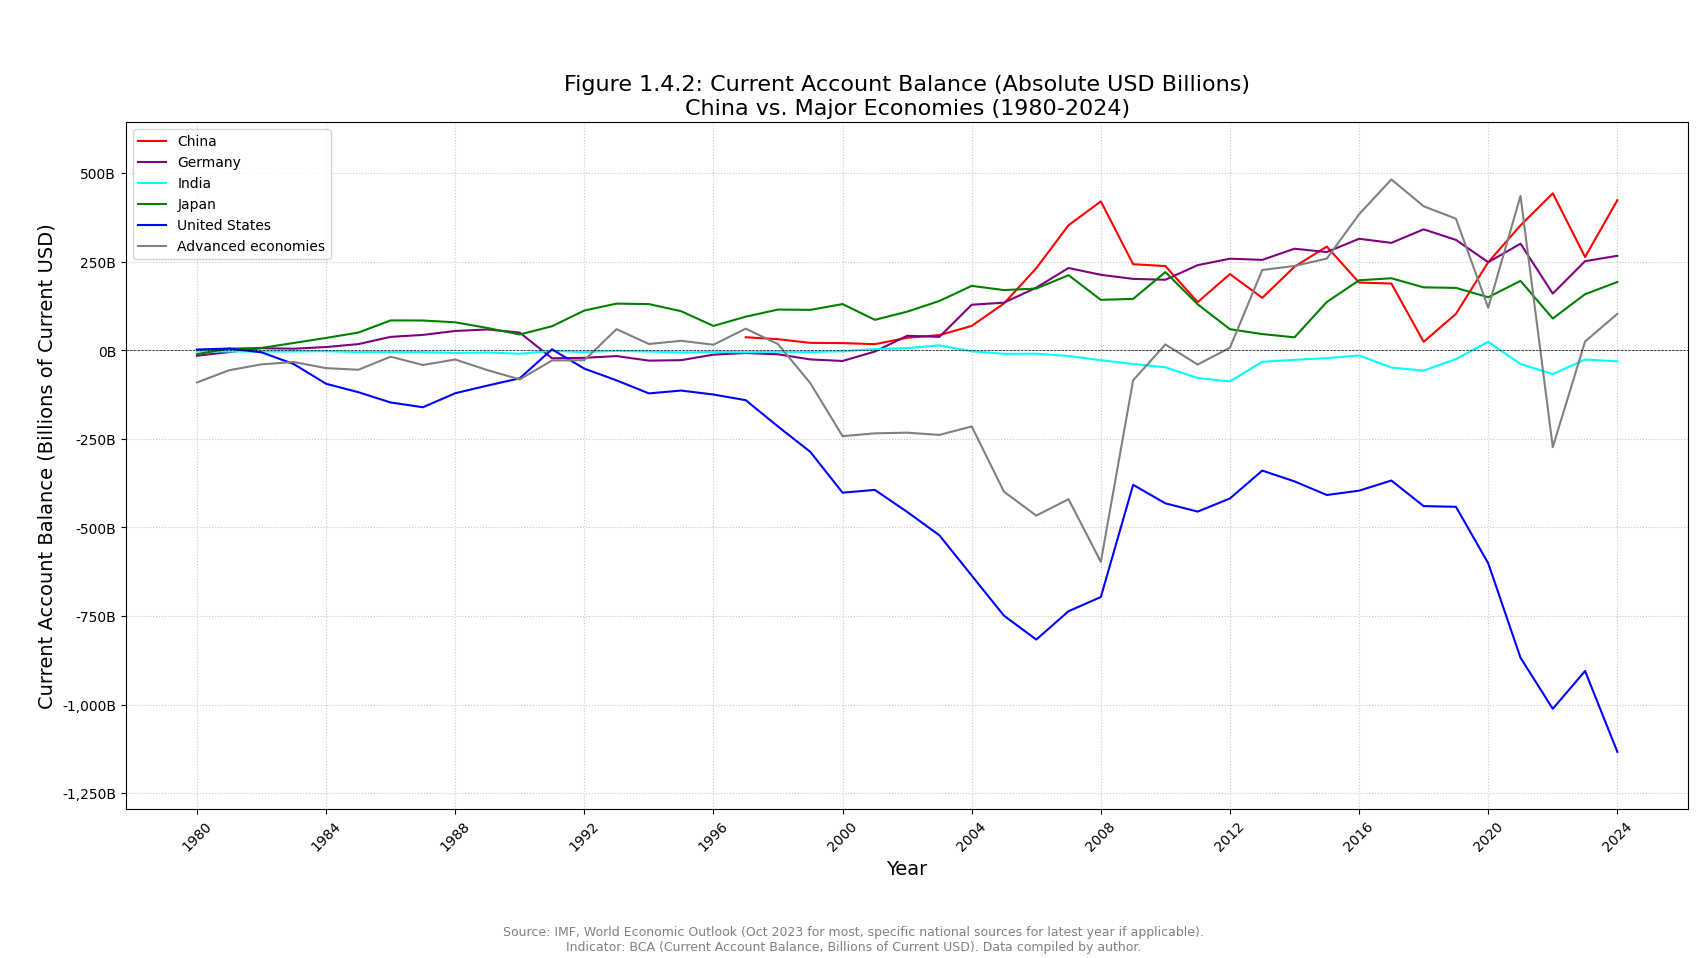
Data Box 1.4: China’s Current Account Balance – Relative vs. Absolute Significance
The Current Account Balance (CAB) reflects a nation’s economic interaction with the global economy through trade, income flows, and transfers. Analyzing China’s CAB as both a percentage of GDP and in absolute dollar terms provides complementary insights.
1. Current Account Balance (% of GDP)
China’s CAB peaked around 10% of GDP in 2007 and subsequently moderated to around 1-2.5% for much of the 2010s, with occasional increases such as post-COVID. Even at lower percentages, this persistent surplus highlights China’s enduring domestic savings-investment imbalance.
Comparison with Germany and Japan:
- Germany: Typically records higher CAB surpluses (as % GDP) than China, driven by export competitiveness, integration into EU/global value chains, and structural advantages from Euro membership. Germany’s surplus reflects high national savings combined with comparatively lower domestic investment.
- Japan: Maintains consistent surpluses primarily due to significant net income from decades of foreign investments. Japan’s competitive export sectors, demographic factors, and mature industrial structure support persistent surpluses.
China’s Distinction: Unlike Germany and Japan, China’s surplus is rooted in suppressed household consumption due to low household income shares, precautionary savings driven by weaker social safety nets, and state-driven investment funded by substantial corporate (especially SOEs) and government savings. Thus, China’s surplus directly indicates deep internal imbalances.
Other Global Contexts:
- United States: Consistently runs large deficits as a global consumer and capital importer.
- India: Typically shows deficits due to investment needs exceeding domestic savings.
China’s CAB persistence underscores its incomplete shift toward consumption-driven growth, highlighting structural economic challenges rather than surplus scale alone.

2. Current Account Balance (Absolute U.S. Dollar Terms)
Given its massive economy, China’s absolute CAB surplus regularly ranks among the world’s largest. Even modest percentages of China’s GDP yield substantial absolute surpluses ($180-$360 billion annually for 1-2% of an $18 trillion economy), significantly impacting global financial markets.
Global Impact: China’s large absolute surplus positions it as a leading global capital exporter, significantly shaping worldwide investment flows and financing deficits elsewhere, notably in the U.S.
Comparison with Germany and Japan: While Germany and Japan also record substantial absolute surpluses, reflecting their economic size and export strengths, China’s surplus frequently matches or exceeds theirs, emphasizing China’s vast production capacity and continued reliance on external markets.
Qualitative Differences Behind Similar Numbers:
Though Germany, Japan, and China all exhibit significant surpluses, their underlying causes vary substantially:
- Germany and Japan: Mature, high-income economies with strong domestic consumption, advanced social welfare systems, specialized export sectors, and robust international investment positions. Their surpluses reflect mature industrial competitiveness, favorable macroeconomic conditions (Eurozone dynamics for Germany), and accumulated foreign investment income (Japan).
- China: Persistent surplus stems directly from structural imbalances—low household income shares, high precautionary savings, insufficient social safety nets, and investment-heavy, state-driven economic growth. China’s external surplus is thus symptomatic of deep internal economic imbalances.
Recognizing these qualitative distinctions is crucial. China’s challenge in rebalancing is unique, necessitating addressing specific internal structural and policy issues rather than merely focusing on the scale of its surplus.
The Chinese economy thus remains structurally geared to produce significantly more than it consumes domestically. This foundational paradox generates a complex nexus of internal economic risks—such as diminishing returns on investment, asset bubbles, and inefficient capital allocation (detailed in subsequent Chapters)—and significant external friction within the global trade and financial system (explored in Chapter 6). Understanding this core imbalance is the essential starting point for dissecting the multifaceted challenges of China’s ongoing rebalancing imperative, an undertaking whose success is far from guaranteed and whose trajectory is fraught with the tensions between economic logic and entrenched political-economic structures.
2. The Household Squeeze: Structural Barriers to Consumption
What structural barriers (income share, safety nets, housing costs) prevent Chinese households from spending more, forcing high savings even as the nation gets richer?
The core paradox of China’s unbalanced economic engine, as established in chapter 1, is centrally characterized by persistently low household consumption relative to the nation’s overall output. While high national savings fuel extensive investment, the comparatively muted role of household spending as a primary growth driver points to deep-seated structural impediments. This chapter dissects these barriers, revealing a “household squeeze” where Chinese families, despite rising absolute incomes, are systematically constrained in their capacity and willingness to consume. This is not merely a cultural inclination towards thrift but a rational response to a political economy that has historically limited their share of national income, provided an inadequate social safety net, and channeled significant household resources towards an often burdensome housing market. Understanding these interconnected pressures is vital to grasping why rebalancing towards a more internally driven, consumption-led growth model has proven so profoundly challenging for Beijing.
Foremost among these constraints is the structurally low share of national income accruing to households. While many economies see household income and consumption shares rise or stabilize as they mature and transition towards service-based structures, China’s trajectory has been notably divergent. After an initial period where household income represented a larger portion of the economy, this share experienced a relative decline during the decades of hyper-growth fueled by investment and exports. Even with subsequent recovery, the portion of GDP ending up in household pockets remains significantly below levels observed in most developed economies and, critically, below what historical precedents from other East Asian economies at similar developmental stages would suggest. This persistent suppression of the household income share fundamentally limits the aggregate purchasing power available to drive consumption.
Several mechanisms contribute to this suppressed income share. For extended periods, policies such as financial repression—whereby interest rates on household bank deposits were deliberately kept low, often below inflation—effectively transferred wealth from savers (primarily households) to borrowers (often state-owned enterprises and government entities funding investment). This directly curtailed household income derived from capital. Furthermore, the profit distribution patterns of a state-dominated corporate sector, particularly State-Owned Enterprises (SOEs), tend to favor reinvestment or remittances to the state over substantial dividend payouts to a broader shareholder base or significantly higher wage growth relative to productivity gains. While the detailed role of SOEs will be explored in Chapter 4, their impact on channeling national income away from households is a critical factor here. The sheer scale and internal diversity of China, with significant regional income disparities between affluent coastal areas and lagging inland provinces, adds another layer of complexity, though the national aggregate figure remains stubbornly low, underscoring a systemic issue.
Data Box 2.1: China’s Household Income Share of GDP – Analysis, Comparisons, and Regional Nuances
The share of household income within a nation’s GDP significantly influences economic distribution and domestic consumption capacity. China’s trajectory highlights intricate dynamics shaped by historical developments, structural policies, and regional disparities.
1. National Trends and Comparative International Analysis
Over the past two decades, China’s household income share gradually rose from approximately 57-58% in the mid-2000s to about 60-61% by 2023. This recent upward trend represents a partial recovery following a sharp decline during China’s rapid industrialization and investment-intensive growth period in the 1990s and early 2000s, where households’ income shares were notably suppressed.
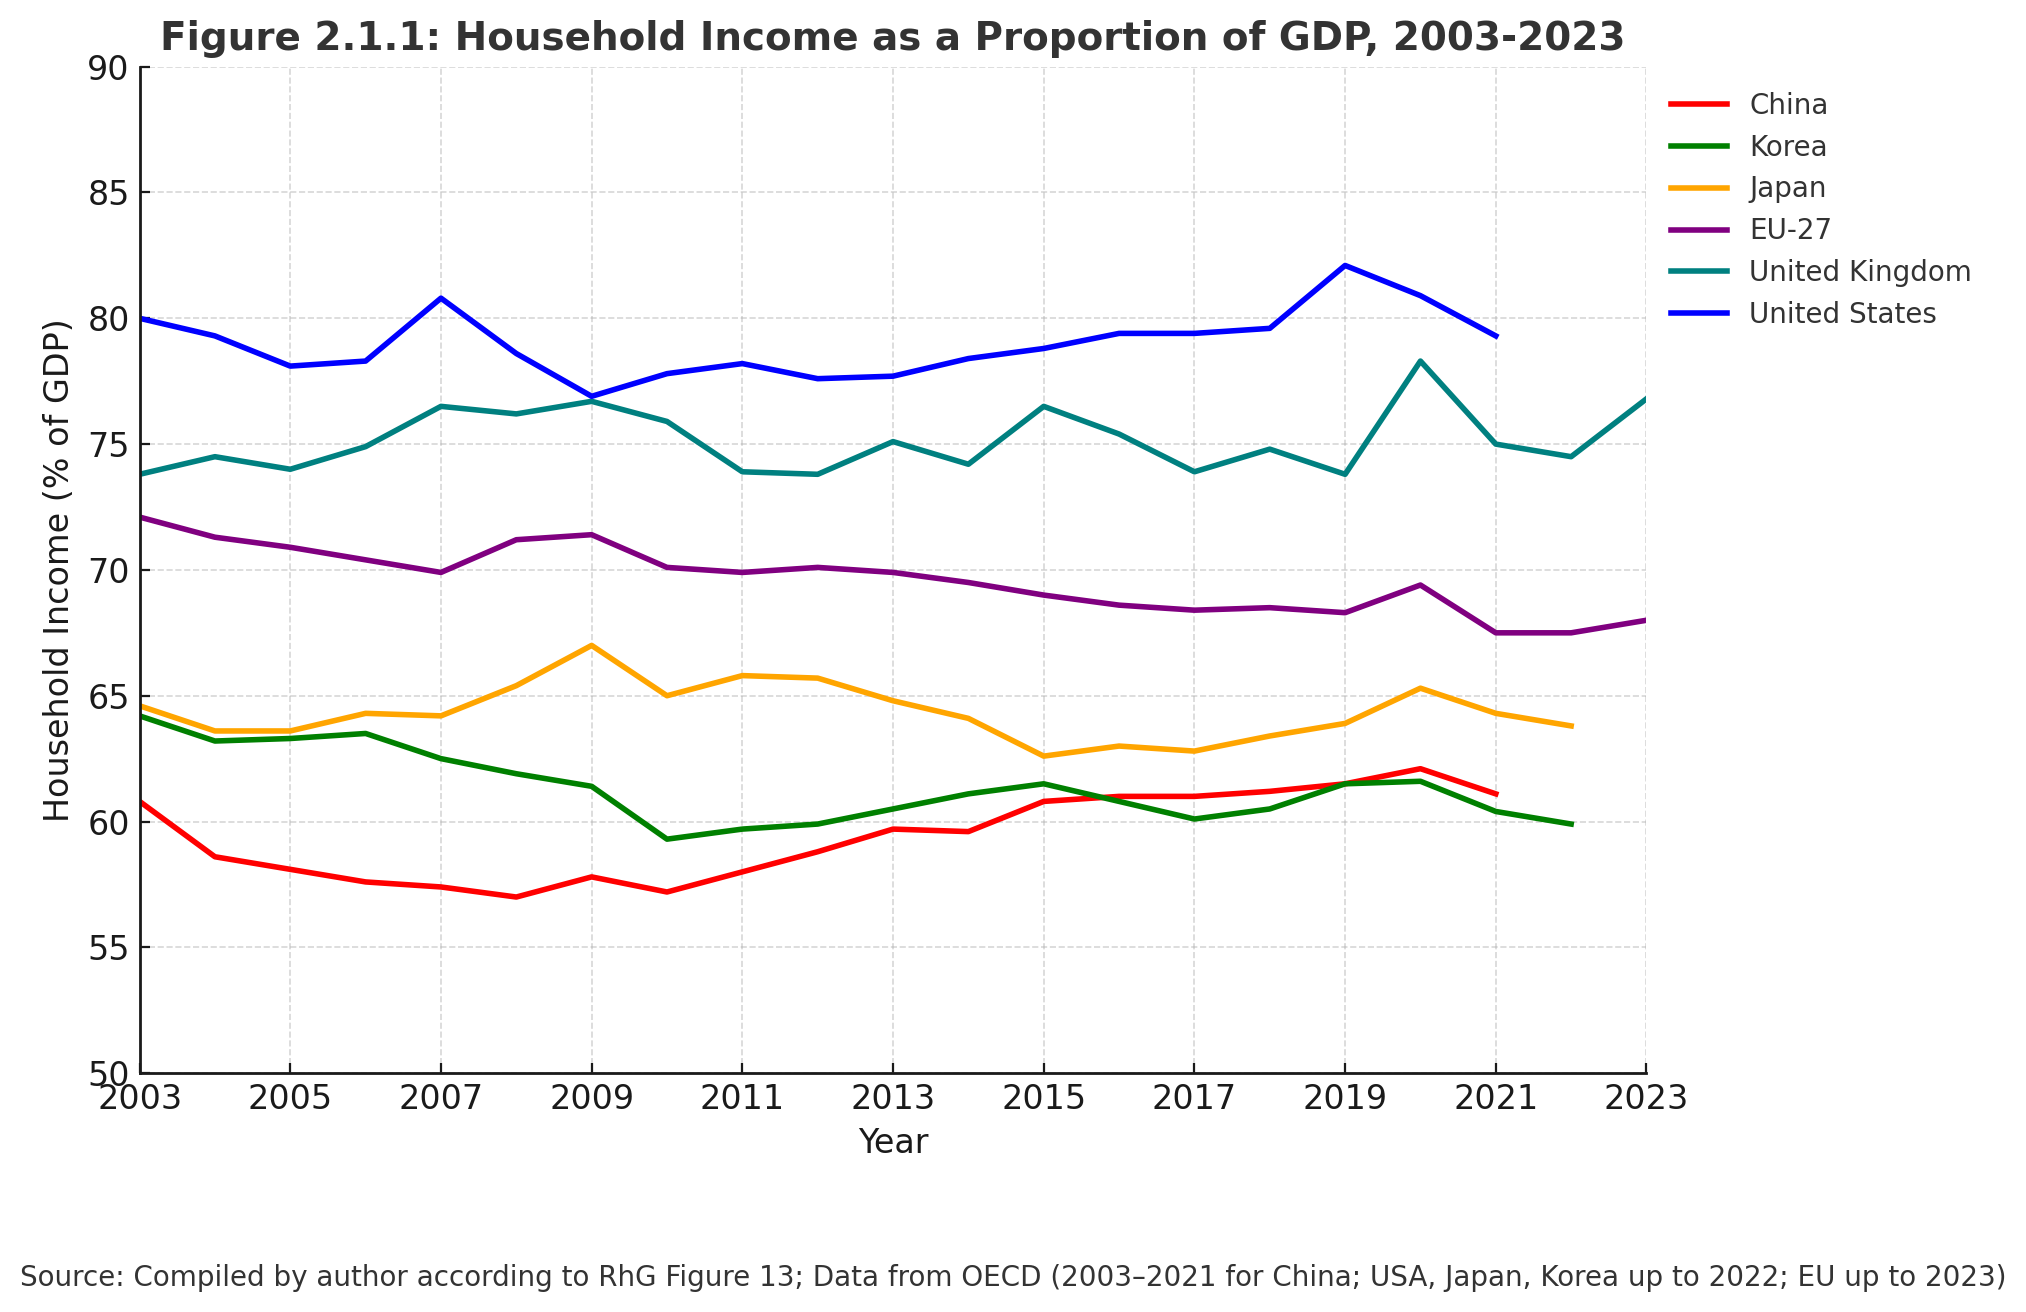

Detailed Comparative Context:
- Developed Western Economies: Despite improvements, China’s household income share remains significantly lower compared to advanced Western economies such as the United States (78-82%) and the European Union average (68-72%). This gap underscores fundamental structural differences, including more developed social safety nets, higher wage levels, and a more consumption-driven growth model prevalent in Western economies.
- East Asian Comparative Dynamics:
- Japan: Maintains a consistently higher household income share (63-67%), supported by established income distribution mechanisms, a mature welfare system, and corporate structures such as the Keiretsu, which, despite their interconnected nature, allocate substantial profits directly into household incomes.
- South Korea: Historically higher household income shares relative to China have recently converged around the 60-61% mark. Yet, critical structural nuances persist. South Korea’s Chaebols typically distribute a larger proportion of profits through direct wages, dividends, and employee benefits, fostering stable household income streams. By contrast, China’s State-Owned Enterprises (SOEs) retain a significant portion of profits for reinvestment or state-directed expenditures, limiting direct household distributions and necessitating compensatory mechanisms like government transfers to sustain household income levels.
Structural and Institutional Considerations:
Beyond corporate profit distribution mechanisms, differences in state intervention policies, welfare provisions, and financial regulatory frameworks further distinguish China’s income dynamics from those of Japan and South Korea. China’s financial repression, limited direct corporate profit sharing, and historically underdeveloped social safety nets reinforce precautionary saving behavior and household income suppression, creating deeper economic fragility compared to its East Asian counterparts.
Rebalancing China’s Economic Model:
While the increase in China’s household income share is encouraging, its effectiveness and sustainability require careful consideration:
- Pace of Transition: The incremental nature of household income share increases raises concerns about the adequacy and timeliness relative to China’s moderating GDP growth.
- Sustainability of Drivers: Reliance on temporary fiscal measures or superficial policy interventions, rather than foundational reforms in income distribution (such as wage growth and profit distribution policies), may limit long-term impact.
- Persistent Structural Constraints: Factors such as SOE profit retention practices, Hukou system restrictions affecting migrant incomes, and the perceived inadequacy of social safety nets continue to constrain substantial improvements in household consumption capacity.
2. Internal Regional and Social Income Diversity
National averages obscure substantial internal variations, essential for a comprehensive understanding of China’s economic landscape:
- Regional Inequality: Stark disparities remain pronounced. In 2023, per capita disposable income in prosperous coastal areas such as Shanghai (RMB 84,834) and Beijing (RMB 81,752) vastly exceeded less-developed western regions like Gansu (RMB 25,011) and northeastern provinces like Heilongjiang (RMB 29,694). These differences highlight persistent uneven development and structural policy biases.
- Urban-Rural Divide: Within each province, urban households consistently demonstrate significantly higher income levels compared to rural areas, driven by varied economic opportunities, industrial structures, infrastructure availability, and resource accessibility.
- Historical and Structural Drivers: These regional and urban-rural disparities originate from coastal-centric development policies, varied industrial compositions, uneven impacts of urbanization, and Hukou system restrictions that limit labor mobility and urban welfare access.
Policy and Structural Reform Implications:
To effectively enhance China’s overall household consumption and achieve the policy goal of “Common Prosperity,” targeted interventions are crucial. Policymakers must address deep-rooted regional inequalities, promote income redistribution, strengthen social safety nets, and reform corporate governance, particularly within SOEs. Without addressing these underlying disparities and structural impediments, China’s transition toward a sustainable, consumption-driven economy will remain incomplete.
Conclusion:
China’s improving household income share is promising but must be contextualized within historical suppression, ongoing structural challenges, and deep regional disparities. A genuinely balanced economic transition necessitates comprehensive structural reforms and nuanced policy interventions tailored to China’s unique socio-economic landscape.
Definition Box 2.1: Financial Repression – Mechanisms and Impacts in China
What is Financial Repression?
Financial repression describes government policies that artificially distort financial markets to direct funds to state-favored sectors or objectives at below-market costs. These policies intervene in market-determined interest rates, exchange rates, and capital allocation, typically disadvantaging household savers and private enterprises outside state priorities.
Key Mechanisms in China’s Context:
Historically, China extensively employed financial repression to sustain its investment-driven and export-oriented economic model, primarily from the 1980s through the mid-2010s. Key methods included:
- Interest Rate Controls: The People’s Bank of China (PBOC) set deposit interest rates below market-clearing levels and often below inflation, resulting in prolonged negative real returns for households.
- Directed Credit and State-Dominated Banking: The largely state-owned banking system preferentially allocated credit to State-Owned Enterprises (SOEs), infrastructure, and strategic industries at subsidized rates.
- Capital Controls: Restrictions on international capital flows limited households’ investment options, reinforcing low domestic returns on savings and insulating the domestic financial market.
- High Reserve Requirements: Imposed high reserve requirements constrained banks’ lending capacity, ensuring a stable, low-cost funding source for the government and controlled credit growth.
Quantitative Impacts and Evidence:
Extensive research quantifies the effects of these policies in China:
- Implicit Tax on Households: Studies by economists such as Lardy (2008, 2012) estimated the implicit tax from negative real interest rates to be several percentage points of GDP annually during peak periods, effectively transferring wealth from households to state-linked sectors and constraining disposable household income.
- Suppressed Household Income and Consumption: Low returns on savings limited household income growth and contributed to the persistently low household income share of GDP, dampening household consumption’s role in economic growth.
- Investment Misallocation: Cheap capital availability fueled high investment rates but often resulted in misallocation. State-linked entities accessed abundant, subsidized credit even when returns on investments were lower compared to constrained private enterprises, potentially reducing overall productivity and efficiency.
- Current Account Imbalances: Financial repression reinforced the structural gap between savings and investment, sustaining large current account surpluses by suppressing domestic consumption and promoting high savings rates.
Legacy and Current Relevance:
Although China has significantly liberalized financial markets since the mid-2010s (e.g., interest rate liberalization and capital market development), the historical impacts of decades-long financial repression persist. Residual biases favoring SOEs in credit allocation and underdeveloped financial markets still influence savings behaviors, consumption patterns, and resource allocation. Addressing these entrenched legacies remains central to China’s ongoing economic rebalancing toward sustainable, consumption-driven growth.
Compounding the impact of a constrained income share is the pervasive necessity for high precautionary savings, driven by deep-seated anxieties about the adequacy of China’s social safety net. While China has achieved remarkable progress in expanding basic coverage for pensions, healthcare, and unemployment insurance, particularly since the early 2000s, the perceived quality, comprehensiveness, and generosity of these systems often fall short of providing genuine financial security for many households. Public social expenditure as a percentage of GDP, though rising, still lags behind that of many OECD countries. This compels households to accumulate substantial private savings as a buffer against future uncertainties and critical life-cycle expenditures:
- Healthcare: Despite near-universal basic health insurance, significant out-of-pocket expenses due to coverage gaps, reimbursement caps for serious illnesses, and co-payments mean that a major health event can be financially catastrophic for many families. This compels significant precautionary savings.
- Education: The high costs associated with ensuring children receive a quality education, from primary through tertiary levels (including historically significant spending on supplementary tutoring, even if recently curtailed by policy), represent a major financial planning burden.
- Pensions: While pension coverage has broadened, concerns about the adequacy of future benefits, especially for those outside the formal urban employment system or in a context of rapid aging, motivate individuals to save substantially for their own retirement.
This environment of pervasive uncertainty rationalizes high household saving rates. Faced with these potential future burdens and an incomplete public shield, families across various income strata curtail current consumption to build a financial buffer, directly dampening aggregate domestic demand.
Data Box 2.2: China’s High Household Savings – International Context and Internal Variations
China’s persistently high household savings rate significantly constrains domestic consumption and shapes its overall economic structure. This phenomenon is not simply cultural but rather reflects rational responses to structural and institutional conditions, notably perceived weaknesses in social safety nets.
1. China’s Household Savings: An International Outlier
Over the past two decades, China’s household net savings rate (as a percentage of net disposable income) has consistently ranked among the world’s highest, typically ranging between 30-35+%. This rate starkly contrasts with averages in OECD countries (generally 5-10%) and advanced economies such as the United States, Germany, Japan, and South Korea. This substantial gap underscores the unique structural conditions driving Chinese household saving behaviors.

2. Internal Variations in Household Savings Rates
Aggregate national figures mask significant disparities across different societal groups in China, shaped primarily by income level, Hukou status, and employment sector:
| Comparison Group | Savings Rate (%) | Year | Source |
|---|---|---|---|
| Urban vs. Rural | |||
| Urban | ~38% | 2020 | IMF Analysis |
| Rural | ~20% | 2020 | IMF Analysis |
| Hukou Status (Urban) | |||
| Migrants | 48.5% | 2010-2013-2017 | Tan et al. (2021) |
| Locals | 39.9% | 2010-2013 | Tan et al. (2021) |
| Income Level | |||
| Low-Income | ~32% | 2020 | IMF Analysis |
| Middle-Income | ~36% | 2020 | IMF Analysis |
| High-Income | ~39% | 2020 | IMF Analysis |
| Public vs. Non-Public Employees | |||
| Public Sector Employees | Higher by 3-8 pp | – | Xu, Can; Steiner, Andreas (2022) |
These internal disparities highlight that vulnerability, income insecurity, and differential access to public services significantly influence savings behaviors. Migrants, lacking stable urban social protections due to Hukou restrictions, save at notably higher rates, driven by precautionary motives and future uncertainties.
3. Social Safety Nets and Precautionary Savings
The primary factor underlying China’s high household savings rate is strong precautionary saving behavior—households setting aside significant resources to mitigate risks related to healthcare, retirement, and education due to perceived inadequacies in public welfare systems:
- Healthcare: Basic health insurance covers most people, but gaps and low reimbursement rates result in high out-of-pocket costs and potential catastrophic health expenses. Migrants often face additional access barriers in urban areas.
- Pensions: China’s fragmented pension system, characterized by varying and often modest benefits, fosters uncertainty about retirement income adequacy, prompting individuals to accumulate substantial personal savings.
- Education: While public education is broadly available, families incur significant supplementary educational expenses, including tutoring and higher education preparation, fueling further saving needs.
Bottom Line :
The exceptionally high household savings rate in China, coupled with pronounced internal variations, highlights the profound impact of structural factors and social policy limitations. Strengthening social safety nets and addressing access inequalities can significantly reduce excessive precautionary saving, thereby enhancing household consumption and contributing to China’s broader economic rebalancing.
Finally, the extraordinary burden of housing costs and the associated surge in household debt acts as a third major constraint on discretionary household spending. Driven by a confluence of factors including rapid urbanization, housing’s role as a primary investment vehicle in an environment of limited alternatives, government land policies, and strong cultural preferences for homeownership, property prices in major Chinese cities have reached levels that are exceptionally high relative to average incomes. To achieve the deeply ingrained aspiration of owning a home, households have been forced to dedicate vast resources towards accumulating down payments—often requiring financial support pooled across multiple generations—and subsequently servicing substantial mortgage debt. Consequently, household debt as a percentage of GDP, primarily driven by mortgages, has surged dramatically from below 20% in 2008 to over 60% by the early 2020s. While this credit expansion has facilitated property acquisition, the resulting debt service obligations consume a significant portion of monthly household income, directly limiting funds available for other forms of consumption. The recent downturn in the property market, while aiming to correct speculative excesses, may also negatively impact consumer confidence through wealth effects, further tempering spending.
Data Box 2.3: China’s Housing Affordability Crisis and Household Debt – The “Double Bind”
China’s persistently high household savings and constrained domestic consumption are significantly intensified by the “double bind” of extreme housing costs and mortgage-heavy household debt, limiting disposable income far beyond what aggregate debt-to-GDP ratios might imply.
1. Extreme Housing Price-to-Income Ratios (P/I)
The Price-to-Income (P/I) ratio measures housing affordability by indicating how many years of median household income are required to buy a median-priced home. Chinese Tier-1 cities consistently rank among the world’s least affordable, severely impacting household financial stability and consumption capacity:
| City | Country | P/I Ratio |
|---|---|---|
| Beijing (2015) | China | 18.1 |
| Beijing (2025) | China | 37.4 |
| Shanghai | China | 38.0 |
| Shenzhen | China | 27.5 |
| Hong Kong | China (SAR) | 28.6 |
| London | UK | 20.3 |
| New York | USA | 15.3 |
| Tokyo | Japan | 14.7 |
Source: Numbeo 2025, RIETI.
China’s extreme ratios (typically 25–40 years of income) significantly surpass those of other expensive global cities (15–20 years), driven by intense demand, cultural emphasis on homeownership, and multi-generational wealth pooling to afford initial down payments.
2. Rapid Household Debt Accumulation and Mortgage Dominance
China’s household debt-to-GDP ratio escalated sharply from approximately 18% in 2008 to over 63% by 2023. Although lower than some developed countries (e.g., the US), China’s debt composition imposes significantly higher monthly financial burdens on households:
- Mortgage Concentration: Mortgages are the single largest component (≈ 60 percent) of Chinese household debt. The remaining 40 percent consists of high-cost consumer credit, auto loans, and small student‐loan balances. By contrast, many advanced economies have even higher mortgage shares (≈ 65 – 80 percent), but their non‐mortgage debt (student, auto, credit‐card) typically carries lower rates or longer tenors, softening monthly payment pressures.
- Consumer Credit Expansion: Short-term consumer credit via digital platforms (Alipay, WeChat Pay) accounts for roughly 10–15% of household debt. However, these loans are secondary compared to the substantial mortgage obligations households carry.

3. Why China’s Housing Debt Burden Is Higher Despite Lower Debt-to-GDP
China’s lower overall debt-to-GDP ratio masks the real financial pressures households face:
| Metric (2023) | China | United States |
|---|---|---|
| Mortgage share of household debt | ≈60% | ≈70% |
| Average mortgage interest rates | 3.5–4.5+% | 2.7–4.5% (pre-2022) |
| Median P/I ratio (largest cities) | 25–40 | 15–20 |
| Mortgage payment as % household income | 40–60% | 25–30% |
High interest rates, substantial down payments (typically 20%), and extreme housing prices severely constrain monthly disposable income, placing significantly heavier cash-flow pressures on Chinese households compared to their counterparts in developed economies, even where aggregate debt-to-GDP ratios appear higher.
4. Economic and Policy Implications
- Consumption Constraint: High mortgage repayments and upfront housing costs limit discretionary spending, significantly impeding China’s shift toward domestic consumption-led growth.
- Financial Vulnerability: Elevated mortgage burdens expose households to significant risks from economic shocks, interest rate increases, or housing market downturns, potentially impacting broader economic stability.
- Policy Imperatives: Sustainable economic rebalancing requires policy measures addressing housing affordability, including land-use reforms, taxation adjustments, diversified household asset options, and improved social welfare systems to mitigate excessive reliance on real estate as the primary asset.
In concert, these three structural forces—a limited household share of national income that deviates from typical development trajectories, systemic incentives for high precautionary saving arising from gaps in social welfare provision, and the immense financial weight of the housing market—create a powerful and persistent squeeze on household consumption potential. Addressing this “consumption conundrum” is not a matter of simple stimulus measures; it necessitates deep, politically sensitive reforms targeting income distribution, the architecture of the social safety net, and the fundamental role of property in the economy. These are reforms that directly confront entrenched interests and the established mechanisms of China’s state-led development model, testing the leadership’s resolve and capacity to genuinely re-engineer the drivers of the nation’s growth. The difficulty in overcoming these barriers directly contributes to the imbalances detailed in Chapter 1 and sets the stage for the debt-related challenges explored in Chapter 3.
3. The Debt Drag: Stimulus Legacy, Diminishing Returns, and Constrained Rebalancing
How did the post-2008 stimulus legacy create a debt overhang (LGFV, property) that now yields diminishing returns and constrains policies needed for rebalancing?
The constraints on China’s household consumption, detailed in the previous chapter, represent one critical facet of its rebalancing challenge. However, the other side of the economic ledger—the investment-driven growth model—has simultaneously generated its own formidable set of structural impediments. China’s decisive response to the 2008 Global Financial Crisis (GFC) successfully averted a sharp economic downturn through a massive credit-fueled stimulus. Yet, this intervention, while lauded at the time for its efficacy in supporting global growth, sowed the seeds of a colossal debt overhang. This legacy of debt, concentrated particularly in local government financing vehicles (LGFVs) and the sprawling property sector, now acts as a significant drag on the economy. It is characterized by diminishing returns on new investment and severely constrains the policy space Beijing needs to navigate towards a more sustainable, consumption-driven growth model. Understanding the genesis, scale, and multifaceted consequences of this debt burden is crucial to appreciating the depth of China’s rebalancing predicament.
The sheer scale of China’s debt accumulation in the post-GFC era is striking. Prior to 2008, China’s total non-financial debt (encompassing government, corporate, and household sectors) was at a relatively manageable level, estimated to be around 140-160% of GDP. The ¥4 trillion stimulus package unleashed in 2008-2009, predominantly channeled through bank lending and off-balance-sheet entities, triggered an unprecedented credit expansion. By the late 2010s, total non-financial debt had surged past 250% of GDP, and by end-2023/early 2024, prominent estimates placed this ratio at 300%. This rapid leveraging, far outpacing nominal GDP growth over the same period, has brought China’s overall debt burden to levels comparable with, or even surpassing, many highly financialized advanced economies. However, this has occurred without China possessing the same depth of capital markets, robust institutional frameworks for debt resolution, or the established financial shock absorbers typically found in those economies.
Data Box 3.1: China’s Debt Surge Post-2008: Scale, Composition, and Economic Implications
China’s rapid buildup of debt following the 2008 Global Financial Crisis (GFC) significantly reshaped its economic landscape, presenting major risks and policy challenges. This box outlines the scale, composition, and broader economic consequences of China’s debt surge.
1. Rapid Debt Accumulation Post-2008
Before the GFC, China’s total non-financial sector (NFS) debt—covering government, corporate, and household sectors—was around 140–160% of GDP. Triggered by the ¥4 trillion stimulus in 2008–09, debt quickly escalated, reaching over 250% by the late 2010s and approaching 300% of GDP by end-2024. This puts China in the same league as many highly indebted advanced economies, despite lacking comparable institutional safeguards or market depth.

2. Who Holds China’s Debt?

By end-2024, China’s NFS debt was structured as follows:
| Sector | % of GDP (2024) | Share of total debt |
|---|---|---|
| Corporate Sector (NFC) | ≈140% | ≈50 ppts |
| – LGFVs | 42–46% | ≈⅓ of corporate debt |
| – SOEs | 45–53% | ≈⅓ of corporate debt |
| General Government (on-budget) | ≈85% | ≈30 ppts |
| Households | ≈60% | ≈20 ppts |
Source: BIS data.
3. Understanding LGFVs and Their Role
Local Government Financing Vehicles (LGFVs) are special-purpose companies created by local authorities to fund infrastructure and development projects without appearing on official government balance sheets. They emerged due to restrictions on local-government bond issuance, borrowing heavily from banks, bond markets, and shadow credit channels. By 2023, LGFV liabilities totaled roughly ¥55–60 trillion (~40-45% of GDP), accounting for about one-third of corporate debt. The IMF’s augmented metrics reclassify LGFV debt as public sector, raising China’s true public debt significantly.
4. Structural Economic Implications
- State-Directed Dominance: Approximately two-thirds of corporate debt is tied to state entities (LGFVs and SOEs), indicating a government-driven investment focus.
- Declining Investment Efficiency: Each additional yuan of debt now generates progressively less economic growth, shown by China’s sharply rising Incremental Capital-Output Ratio (ICOR).
- Limited Policy Flexibility: Heavy obligations from LGFV and SOE debts consume fiscal and banking resources, reducing available funds for social spending and consumer-focused stimulus.
Household Debt Trends Post-2020: Post-2020, household debt relative to GDP stabilized and even declined slightly due to property-market weakness, accelerated debt repayment, and increased consumer caution. This reinforces that China’s post-2008 debt surge primarily reflects state-directed, infrastructure-focused borrowing rather than household leverage.
5. Key Takeaways for Economic Rebalancing
China’s post-2008 debt growth—particularly via opaque LGFVs and SOEs—poses major barriers to shifting towards a consumption-driven economy. Effective rebalancing requires:
- Significant restructuring of LGFV debt;
- Reforming land-financing mechanisms;
- Strengthening SOE financial discipline;
- Enhancing transparency and market-based financial intermediation.
Addressing these structural debt issues is crucial for achieving China’s stated economic transition goals and maintaining long-term financial stability.
Critically, this explosive growth in credit has coincided with increasingly clear signs of diminishing returns on investment. A key metric illustrating this trend is the Incremental Capital-Output Ratio (ICOR), which measures the amount of additional capital investment required to generate one additional unit of GDP growth. A rising ICOR signals falling investment efficiency. In China’s case, the ICOR has deteriorated markedly. While in the early 2000s, an estimated 3-4 yuan of new investment might have generated 1 yuan of additional GDP growth, by the late 2010s and early 2020s, this figure had climbed towards 6-8 yuan or even higher according to some analyses. This indicates that the vast sums invested, particularly in infrastructure and real estate post-GFC, are becoming progressively less productive in driving economic expansion. Capital is being allocated to projects with lower marginal returns, fueling concerns about resource misallocation and exacerbating debt sustainability challenges. This declining efficiency directly undermines the viability of the old growth model and highlights the urgent need to shift towards more productive growth drivers.
Data Box 3.2:Reading China’s ICOR: Investment Efficiency and Economic Implications
The Incremental Capital-Output Ratio (ICOR) measures the efficiency of investment by showing how many percentage points of GDP invested are needed to generate one additional percentage point of real GDP growth. ICOR is critical for understanding China’s economic trajectory, debt dynamics, and rebalancing efforts.
ICOR = (Gross fixed capital formation % GDP) / Real GDP growth %
1. Interpreting ICOR
- Optimal ICOR (≈3–4): Typical in rapidly growing, developing economies; indicates efficient capital utilization and high economic returns.
- Rising ICOR: Suggests declining capital productivity, signaling that each additional unit of investment yields progressively lower economic growth, often associated with inefficient, debt-driven projects.
- High-Income Economies: With lower investment shares and modest growth, ICOR fluctuates widely, driven primarily by small changes in growth rates rather than genuine investment efficiency.
- Comparative Caution: ICOR comparisons are most insightful when economies share similar development stages and investment intensity.
2. Selected Comparative Benchmarks
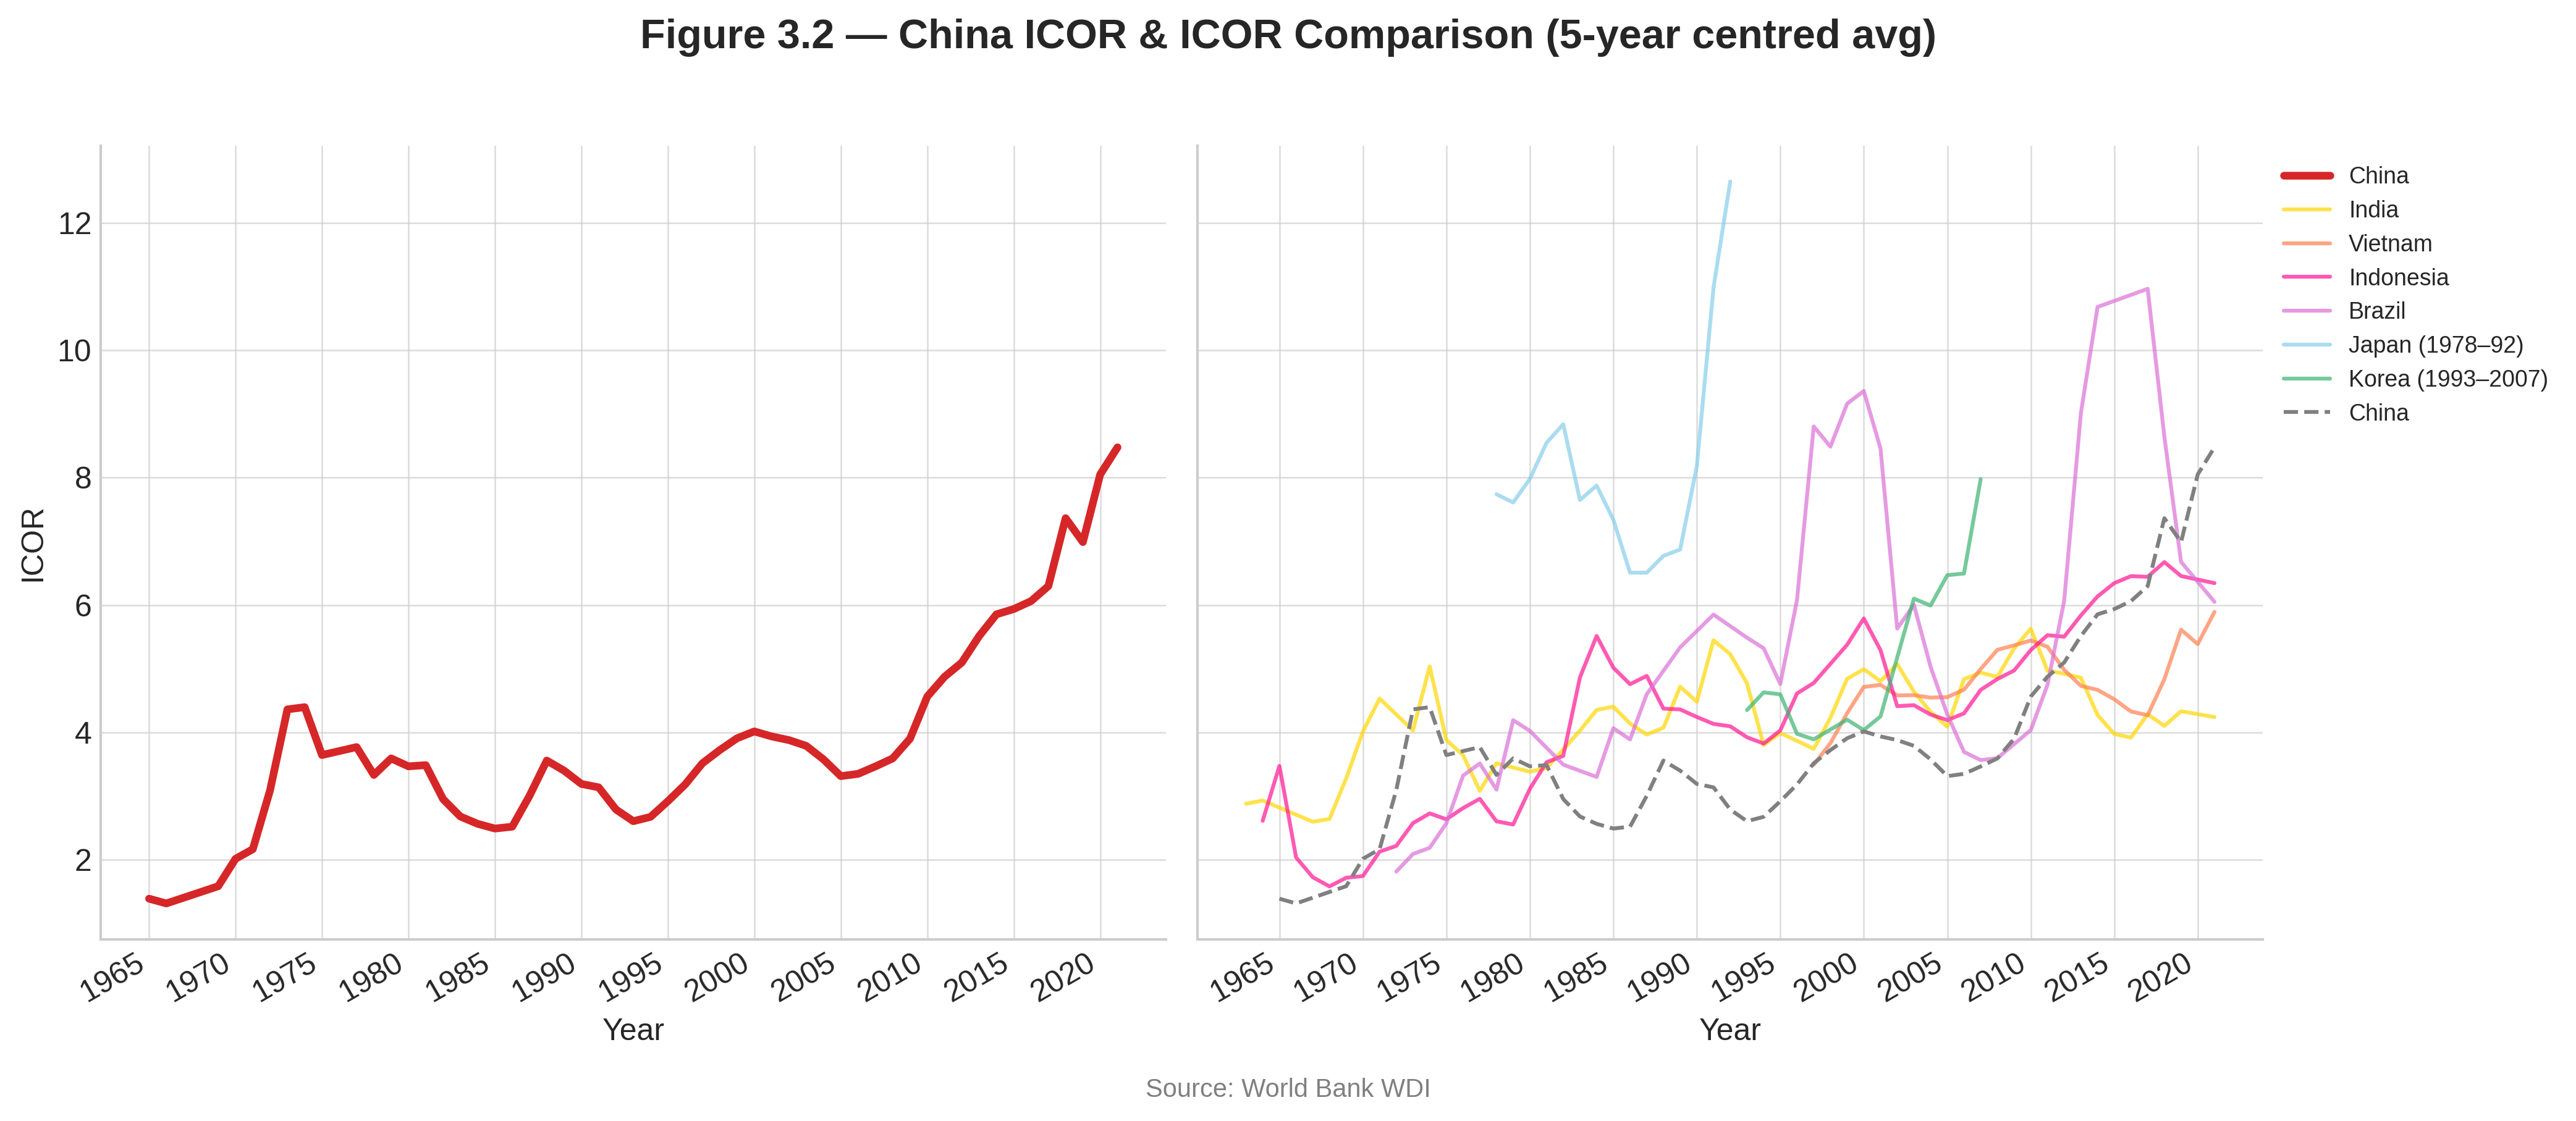
Source: World Bank WDI (NE.GDI.FTOT.ZS and NY.GDP.MKTP.KD.ZG). Data smoothed with five-year centred averages; extreme ICOR values capped at 20 for clarity.
| Economy | Relevance for China’s Economic Analysis |
|---|---|
| India, Vietnam, Indonesia, Brazil | These economies currently have investment rates (25–35% GDP) similar to China, offering valuable contemporary benchmarks for efficient and inefficient capital use. |
| Japan (1978–92), Korea (1993–2007) | Early portions of these periods closely match China’s current per capita income (~USD 17–20k in 2017 PPP) and high investment levels, illustrating ICOR trends before encountering diminishing returns. |
| Current G-7 Economies | Excluded due to low investment shares and modest growth rates, rendering ICOR less meaningful in measuring investment efficiency. |
3. Key Findings from ICOR Trends (Figure 3.2)
- China’s Rising ICOR: China’s ICOR increased significantly from approximately 3.5 in the early 2000s to around 8 today, clearly signaling diminishing returns and reduced capital efficiency.
- Peer Comparisons: India and Vietnam maintain relatively stable ICOR values (around 4–5), while Indonesia and Brazil hover around 6, underscoring China’s notably sharper deterioration.
- Historical Benchmarks: Japan and Korea reached ICOR values around 6–7 just before significant slowdowns in growth and reductions in investment rates. China now faces similar efficiency pressures but maintains nearly double their historical investment shares.
4. Economic Implications of High ICOR
- Debt Intensification: With an ICOR of about 8, sustaining a 5% GDP growth rate requires investment levels around 40% of GDP annually, fueling continued debt accumulation as detailed in Box 3.1.
- Crowding Out Consumption: Persistent high and inefficient investment allocation towards state-driven projects limits resources available for household income growth and private consumption, directly hindering economic rebalancing.
- Reduced Policy Options: Maintaining current growth levels under high ICOR conditions necessitates further increases in debt-driven investment or substantial productivity enhancements, both challenging under existing economic policies.
China’s elevated ICOR underscores its transition from a high-efficiency growth economy to one increasingly burdened by inefficient capital allocation and debt dynamics. Policy efforts must focus on significantly improving investment productivity, restructuring state-directed investments, reforming land-financing mechanisms, and realigning resources to support household incomes and consumption-driven growth.
A significant portion of this problematic debt is concentrated within opaque structures linked to local governments, primarily Local Government Financing Vehicles (LGFVs). Historically prevented from borrowing directly to fund their extensive expenditure responsibilities (especially after the 1994 fiscal reforms centralized revenues but not spending obligations), local governments established thousands of LGFVs. These corporate entities borrowed heavily from banks and bond markets, often using land assets as collateral, to finance vast infrastructure projects, especially after 2008. Because this debt was technically corporate, it remained “off-balance-sheet” for local governments, obscuring the true extent of public sector liabilities. Estimates of LGFV debt are enormous, with the IMF’s calculation of “augmented” government debt (including these liabilities) reaching an estimated 110-120% of GDP by 2023, far exceeding official general government debt figures. Many LGFV-funded projects, particularly in less developed regions, do not generate sufficient revenue to service their debts, leading to a reliance on refinancing, land sales (a now diminishing revenue source), or implicit state support. This creates substantial contingent liabilities and constrains local fiscal capacity, diverting funds from essential public services that are crucial for boosting household security and, by extension, consumption.
Parallel to LGFV liabilities, the property sector became another major nexus of leverage and systemic risk. Developers, fueled by easy credit (including from shadow banking channels and offshore borrowing) and expectations of perennially rising prices, accumulated vast debts. The implementation of the “Three Red Lines” policy by regulators in 2020-2021, aimed at deleveraging highly indebted developers, triggered a cascade of defaults, most notably affecting giants like Evergrande. This ongoing property sector downturn has profound negative ramifications: it slashes construction-related investment, erodes household wealth and confidence (thereby dampening consumption, as discussed in Chapter 2), damages the balance sheets of exposed financial institutions, and cripples local government finances by curtailing land sale revenues, which were vital for servicing LGFV debts. The deep interconnectedness of property debt with the broader financial system and local government solvency makes its resolution exceptionally complex and pivotal for economic stability.
Definition Box 3.1: China’s “Three Red Lines” for Property Developers
Introduced in August 2020, China’s “Three Red Lines” policy sets clear financial benchmarks to constrain excessive leverage among real estate developers, thereby mitigating systemic financial risks in the property sector.
| Metric (excluding presale deposits) | Red Line | Policy Intent |
|---|---|---|
| Liabilities ÷ Assets | ≤ 70% | Cap overall leverage |
| Net gearing (Debt ÷ Equity) | ≤ 100% | Limit debt-driven land acquisition |
| Cash ÷ Short-term debt | ≥ 1× | Ensure adequate liquidity for at least 12 months |
Traffic-light system (August 2020):
- 0 breaches: Debt can increase up to 15% annually.
- 1 breach: Debt can increase up to 10% annually.
- 2 breaches: Debt can increase up to 5% annually.
- 3 breaches: Debt growth halted entirely.
Policy Objectives:
- Discourage speculative borrowing and reduce financial sector risk.
- Reinforce the guiding principle: “houses are for living in, not for speculation.”
Immediate Impacts (2021–2023):
- Approximately two-thirds of China’s top-30 developers breached at least one red line within the policy’s first year, significantly restricting their access to bond markets.
- Local governments experienced a 23% decline in land-sale revenue in 2022, compounding financial stress on Local Government Financing Vehicles (LGFVs) highlighted in Box 3.1.
- Prominent developer defaults (Evergrande, Kaisa, Sunac) stalled projects, eroded homebuyer confidence, and triggered a broad credit contraction across the real estate sector.
Funding Channels and Associated Risks:
| Channel | Description | Risks |
|---|---|---|
| Shadow Banking | Trust loans and wealth-management products not listed formally | High interest, low transparency, shifts risks to households and small financial institutions |
| Offshore USD Bonds | Bonds issued via offshore (e.g., Cayman Islands) entities | Foreign-exchange mismatches, weak investor protections; defaults abroad quickly undermined domestic market confidence |
The “Three Red Lines” policy exposed previously hidden leverage levels and abruptly restricted developers’ access to easy credit. Although this transparency was essential for financial stability, the sudden withdrawal of credit precipitated severe stress that quickly extended beyond developers—affecting banks, households, and LGFVs. This interplay amplified the broader debt challenges discussed throughout Chapter 3.
Collectively, this enormous debt overhang—spanning LGFVs, the property sector, and parts of the non-financial corporate sector (especially some SOEs)—acts as a significant drag on China’s economy and severely constrains policy options for rebalancing. High debt levels necessitate cautious monetary policy to avoid exacerbating financial instability. They limit the fiscal space for substantial stimulus aimed at boosting household consumption or social welfare, as resources may be preempted by the need for potential bailouts or debt restructuring operations. Furthermore, the prevalence of “zombie” firms (indebted, unproductive entities kept afloat by rolling over loans) and non-performing assets locks up capital and labor that could otherwise be reallocated to more dynamic and innovative sectors, thereby hindering overall productivity growth. Effectively managing this debt legacy, which involves difficult choices about restructuring, addressing moral hazard, and reforming the underlying governance of local finance and state-linked investment, is therefore an indispensable prerequisite for China to successfully transition towards a more balanced, efficient, and sustainable growth trajectory. Failure to do so risks either protracted stagnation under the weight of existing liabilities or a more acute financial crisis that could abruptly derail its rebalancing ambitions and long-term development. This sets the stage for understanding the role of state-controlled entities and resource allocation, which is the focus of Chapter 4.
4. The State’s Shadow: SOE Dominance, Resource Misallocation, and Stifled Dynamism
How does the persistent dominance of State-Owned Enterprises (SOEs) and state-directed resource allocation stifle the private sector dynamism crucial for a consumption- and innovation-led economy?
The legacy of debt and diminishing returns on investment, as explored in Chapter 3, casts a long shadow over China’s rebalancing efforts. Compounding these challenges is the enduring and pervasive influence of the state itself in directing economic activity. While China’s economic miracle since 1978 has been characterized by the rise of a vibrant private sector, the Party-state continues to exert profound control over the economy’s “commanding heights” through its State-Owned Enterprises (SOEs) and its overarching influence on resource allocation. This “State’s Shadow” creates significant structural distortions, systematically misallocating capital, stifling private sector dynamism, and hindering the development of a truly market-driven innovation ecosystem. These factors act as formidable barriers to achieving a more balanced, efficient, and consumption-oriented economic structure, revealing the deep-seated political economy constraints at the heart of China’s rebalancing paradox.
Despite decades of market reforms, SOEs maintain a dominant presence in strategically critical and capital-intensive upstream sectors, including energy, telecommunications, banking and finance, heavy industry, transportation, and critical resources. While their direct share of GDP (often estimated around 25-30%) may be less than that of the private sector, their systemic importance is magnified by their control over essential inputs and infrastructure, and most crucially, by their preferential access to national resources, particularly financial capital. The state-dominated banking system has consistently channeled a disproportionate share of lending towards SOEs and other state-affiliated entities. This occurs not always due to superior commercial merit but often because of implicit state guarantees (reducing perceived default risk for lenders), policy-driven lending mandates, and established political connections.
Data Box 4.1: China’s Preferential Credit Allocation to SOEs vs. Private Firms
This box clarifies the structural bias in China’s bank credit allocation toward State-Owned Enterprises (SOEs) compared to private enterprises and small- and medium-sized enterprises (SMEs), highlighting its economic implications.
Credit Allocation: SOEs vs. Private Firms
| Metric | SOEs | Private Firms (+ SMEs) |
|---|---|---|
| Share of corporate loans | ≈ 45–55% | ≈ 45–55% |
| Share of national GDP | ≈ 25–30% | ≈ 70–75% |
| Share of urban employment | ≈ 13–17% | ≈ 83–87% |
| Average borrowing rate (2023) | ≈ 3.9% | ≈ 4.8% |
What These Numbers Reveal:
- Credit mismatch: SOEs obtain roughly half of all corporate bank loans while generating only about a quarter of China’s GDP and employing fewer than one-fifth of urban workers, indicating significant structural misallocation.
- Cost differential: SOEs consistently enjoy lower interest rates—approximately 1 percentage point lower—compared to private enterprises. This discrepancy provides SOEs with a major competitive advantage, distorting market dynamics.
- Efficiency gap: According to academic and IMF analyses, SOEs typically achieve returns on assets (ROA) of just 2–4%, significantly lower than the 6–8% ROA typical of private firms. Cheap financing thus perpetuates lower-yielding investments.
Sectoral Considerations:
SOEs dominate capital-intensive sectors such as utilities, energy, and transportation, which partially justifies their substantial credit share. Nonetheless, even within these sectors, private firms consistently demonstrate superior productivity and profitability. Preferential financing terms and implicit state backing enable SOEs to outcompete private firms for scarce credit, entrenching capital in lower-yield, less efficient projects.
Implications for Economic Rebalancing:
Persistent credit allocation bias toward SOEs directs capital away from more efficient, higher-return private enterprises, thereby weakening productivity growth and limiting household income growth. These distortions undermine China’s broader objectives of shifting toward a consumption-driven economy, as discussed throughout Chapter 4.
Sources: People’s Bank of China (2023), World Bank China Economic Update (2022), National Bureau of Statistics, Peterson Institute for International Economics (Lardy, 2021), PBoC Financial Statistics (2023).
This systematic bias in resource allocation has several profound and detrimental consequences for the broader economy and the rebalancing agenda:
- Capital Misallocation and Lowered Efficiency: The flow of cheap and abundant credit to SOEs, which often exhibit lower productivity and returns on assets compared to their private sector counterparts, leads to significant capital misallocation. Resources that could have fueled more dynamic and innovative private enterprises are instead locked into often less efficient state-controlled entities. This not only depresses overall economic efficiency and curtails potential GDP growth but also reinforces the investment-led model, as SOEs are frequently the primary vehicles for state-directed, large-scale capital expenditure, often with objectives beyond pure commercial viability.
- Stifled Private Sector Dynamism and Competition: Preferential treatment for SOEs inherently disadvantages private firms, particularly Small and Medium Enterprises (SMEs), which are crucial for job creation, innovation, and broadening the base for household income growth. Facing higher borrowing costs, restricted access to finance, and sometimes regulatory hurdles designed to protect SOE market share (entry barriers), private companies are “crowded out.” This can deter private investment, slow the scaling of innovative startups, and limit the competitive pressures that drive efficiency and consumer-centric innovation. While China boasts globally successful private tech giants, the broader landscape for many smaller or non-strategic private firms remains challenging.
- Hindrance to Consumption-Led Rebalancing: The dominance of SOEs and their operational priorities directly impact the shift towards consumption. SOEs typically retain a larger share of their earnings for reinvestment (often aligned with state strategic goals) or transfer them to the state, rather than distributing them more broadly as wages or dividends that would boost household income and consumption. Moreover, by channeling capital towards capital-intensive projects, the system perpetuates an economic structure that favors returns on capital over broad-based growth in labor income, which is foundational for a consumption-driven economy. The development of a robust, labor-intensive service sector—key for job creation and widespread income distribution—can also be constrained if investment and policy focus remain skewed towards state-led heavy industry or infrastructure.
Data Box 4.2: The Productivity Gap: SOEs vs. Private Enterprises
This box quantifies the productivity and profitability differences between China’s State-Owned Enterprises (SOEs) and private enterprises, highlighting structural inefficiencies resulting from preferential credit allocation.
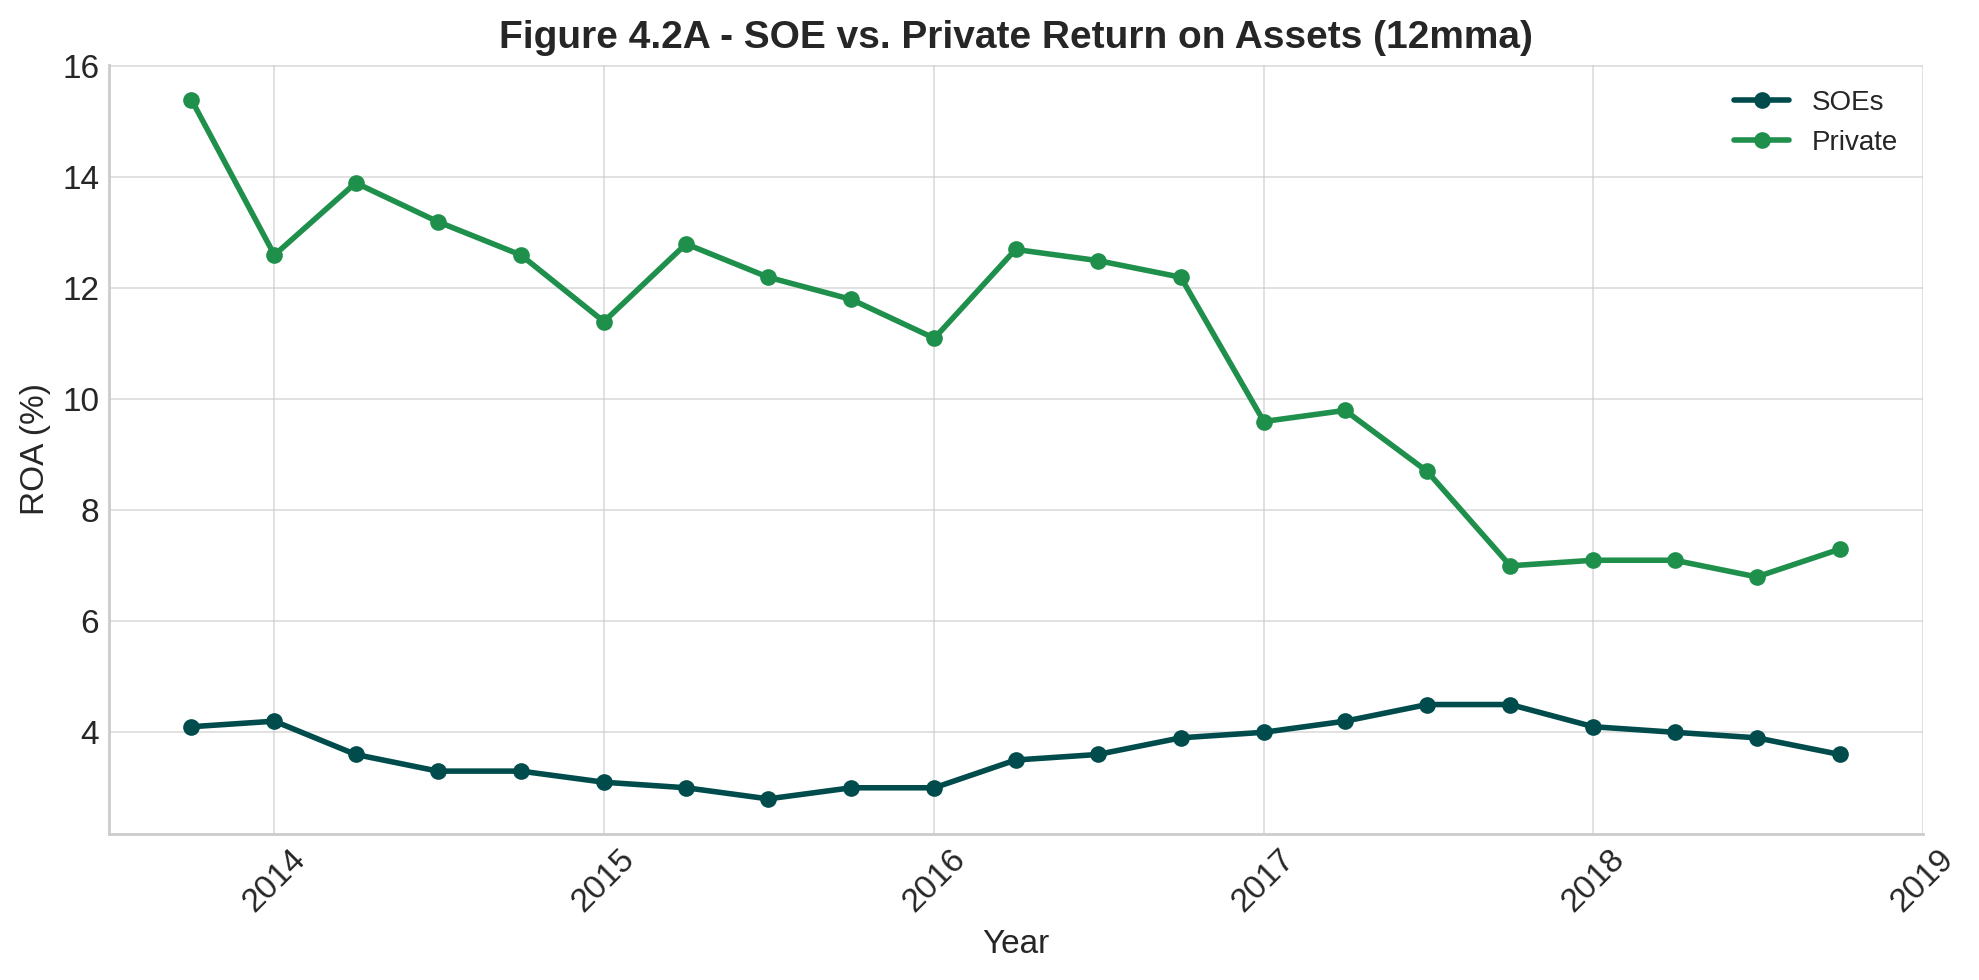
Figure 4.2A — Return on Assets (ROA)
(12-month moving average, 2014-Q3 to 2019-Q3)
- SOEs: Stable at approximately 3.5–4%.
- Private Firms: Declined from around 15% to about 7%.
(Source: Asia Society “China Dashboard,” based on NBS data, Rhodium Group.)
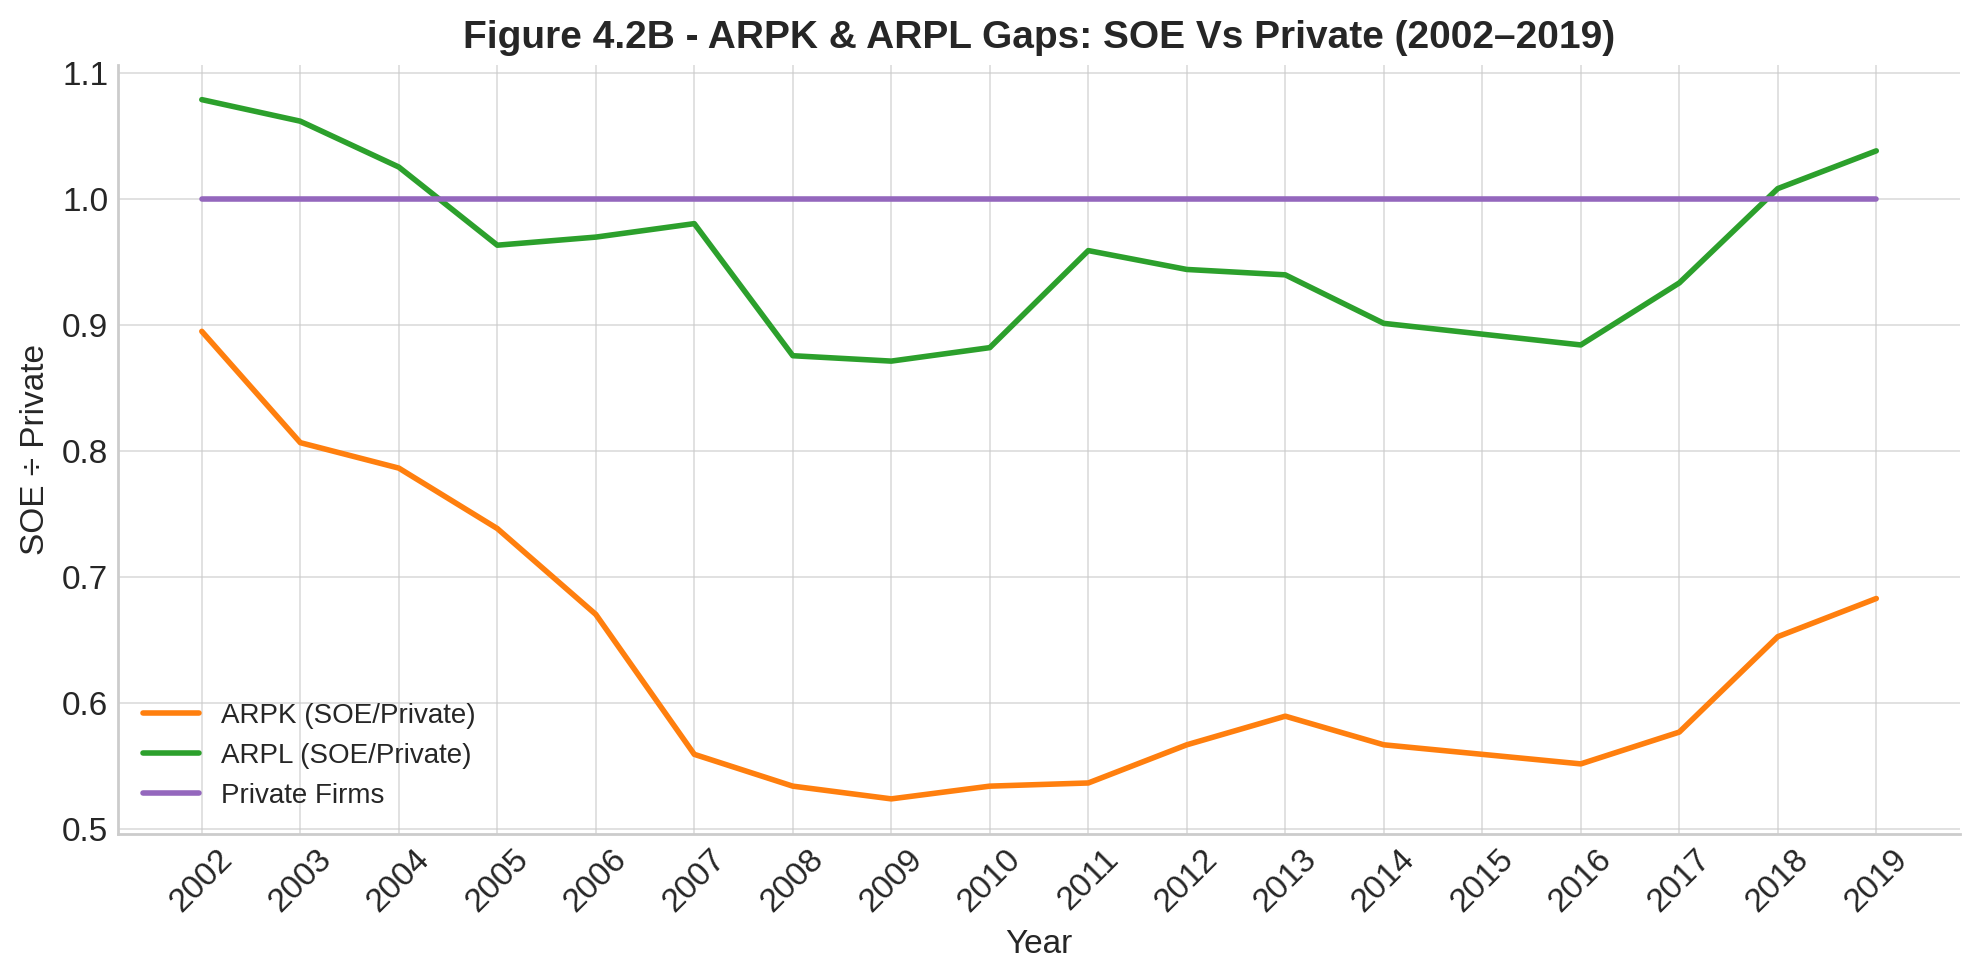
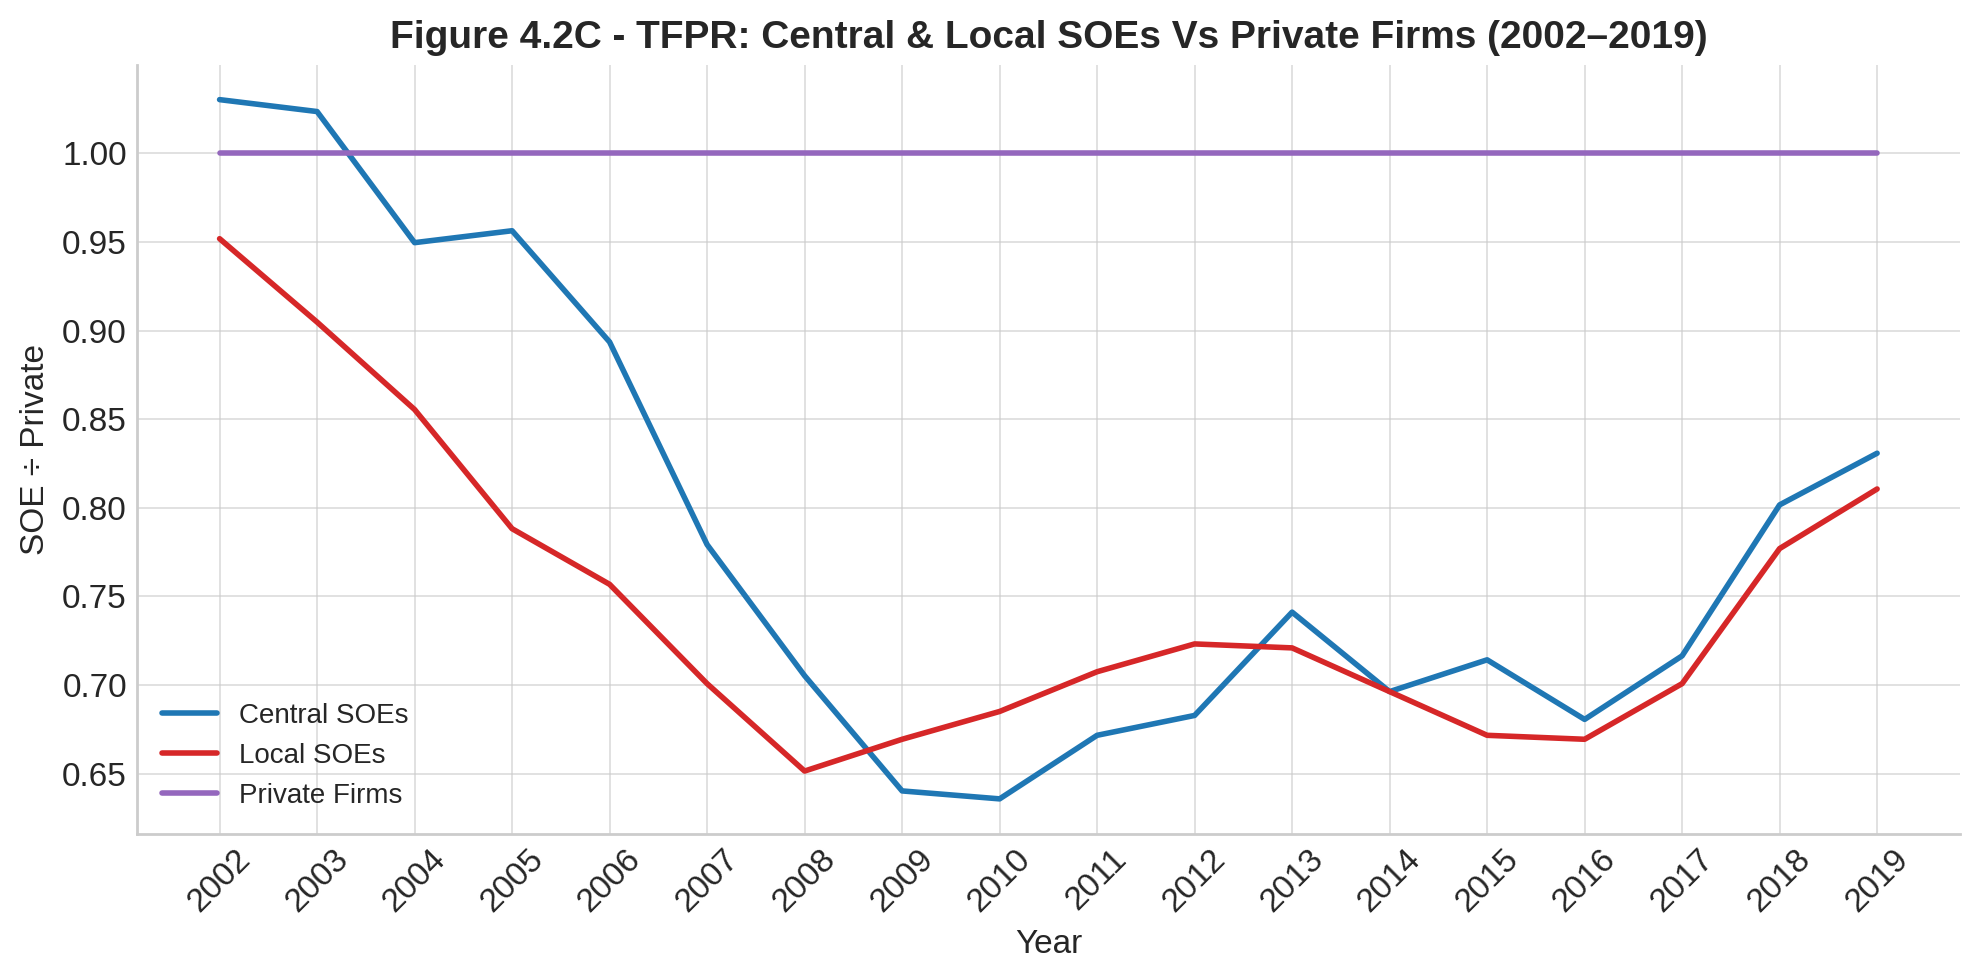
Figures 4.2B – 4.2C — Productivity Ratios (SOE ÷ Private Firms)
(Listed firms, 2002–2019; parity = 1.0)
- Capital Productivity (ARPK): Dropped to approximately 0.6 in 2009, recovering to around 0.8 by 2019.
- Labour Productivity (ARPL): Consistently around 0.85–0.95.
- Total Factor Productivity (TFPR): Fell to about 0.65 in 2009, improved to around 0.84 by 2019.
(Source: IMF WP 21/75.)
Key Metrics Explained:
| Metric | Meaning | Significance |
|---|---|---|
| ARPK | Revenue per unit of capital invested | Efficiency in using capital |
| ARPL | Revenue per employee | Efficiency in labour utilization |
| TFPR | Combined capital and labour efficiency | Overall productivity and resource allocation efficiency |
Key Findings:
- Capital inefficiency: SOEs consistently generate only 60–80% of the revenue per unit of capital compared to private firms, particularly since the 2008 global financial crisis. This gap underscores persistent inefficiencies in capital allocation.
- Labour inefficiency: SOEs maintain roughly 10–15% lower revenue per employee compared to private enterprises. Even considering the more capital-intensive nature of typical SOE sectors, this persistent gap indicates fundamental managerial and operational inefficiencies.
- Overall productivity shortfall (TFPR): Accounting for both capital and labour inputs, SOEs’ total productivity remains approximately 15–35% below that of private firms. Such a significant and persistent gap demonstrates chronic resource misallocation in the state-dominated sector.
- Return on Assets (ROA): By 2019, SOEs achieved an average ROA of just 3.6%, roughly half the 7.3% ROA earned by private firms. Despite preferential access to lower-cost credit (as detailed in Box 4.1), SOEs consistently fail to translate these financial advantages into efficient and profitable outcomes.
Sectoral Considerations:
IMF analyses adjusting for detailed industry classifications confirm these productivity gaps persist even within the same sectors. This suggests systemic factors—such as soft budget constraints, politically driven investment priorities, and implicit state backing—significantly contribute to lower SOE efficiency beyond mere sectoral differences.
Bottom Line:
China’s continued preferential credit allocation toward lower-efficiency SOEs materially reduces overall economic productivity and efficiency. Until capital and resources are more equitably allocated toward higher-return investments, China’s economy will remain heavily reliant on debt-driven growth, thereby impeding the crucial transition towards a more balanced, innovative, and consumption-led economic model.
The challenge is further compounded by regulatory cycles and the overarching emphasis on Party control. Particularly since the late 2010s, a series of regulatory interventions targeting influential private sector domains—notably internet platforms, fintech, and private education—while often justified by legitimate concerns such as curbing monopolistic practices, enhancing financial stability, or promoting “common prosperity,” have also introduced significant policy uncertainty. The abruptness and perceived unpredictability of these crackdowns have had a palpable chilling effect on private sector risk appetite, dampening investment and innovation in key growth areas. While Beijing has subsequently issued rhetoric aimed at reassuring private enterprise, the underlying message of the Party’s ultimate supremacy and its readiness to intervene decisively creates a cautious environment for entrepreneurs.
This persistent state-market imbalance is deeply embedded in China’s political economy. SOEs serve crucial political and social functions for the Chinese Communist Party: they ensure state control over strategic sectors, provide a degree of employment stability (even if inefficiently), act as direct instruments for policy implementation (e.g., undertaking counter-cyclical investment or strategic national projects), and form part of the Party’s extensive patronage network. Consequently, fundamental reforms that would genuinely level the playing field—such as imposing hard budget constraints on SOEs, allowing market-based defaults for failing state firms, comprehensively breaking up state monopolies, or ensuring truly competitively neutral access to credit—often encounter strong resistance from vested interests and challenge the Party’s established levers of economic stewardship. As a result, SOE reforms in the post-GFC era have frequently prioritized consolidation (making SOEs “bigger and stronger”) and the reinforcement of Party leadership within these enterprises, rather than thorough marketization or privatization that might enhance overall economic efficiency but could diminish direct state influence. This reveals a fundamental trade-off the leadership continually navigates: the desire for economic dynamism versus the non-negotiable imperative of maintaining Party control.
The existence of highly successful private “national champions” (like Huawei, Alibaba, Tencent, BYD, CATL) operating in strategic sectors seems to contradict the narrative of a stifled private sector. However, their success often highlights a more nuanced reality: these firms frequently thrived by aligning with national strategic goals, benefiting from targeted (sometimes indirect) state support, accessing alternative financing channels (like international venture capital or stock listings in their growth phases), and demonstrating exceptional innovation and execution. Their success can be seen as the Party-state leveraging private dynamism for specific strategic ends, rather than indicative of a universally level playing field. Even these champions have faced increased regulatory scrutiny, underscoring the Party’s ultimate authority. This complex interplay between state objectives and private sector prowess underscores the unique, and often paradoxical, nature of China’s state-capitalist model. The dilemma for Beijing is whether the exceptionalism of these few champions can be broadened to the entire private sector to truly drive rebalancing, and to what extent this is possible without conceding levels of economic autonomy that might challenge the Party’s preferred model of governance.
Data Box 4.3: Control vs. Dynamism: China’s SOE Reform since 2013
This box highlights the core tension in China’s ongoing State-Owned Enterprise (SOE) reforms, which seek to enhance commercial efficiency and innovation while reinforcing strategic oversight by the Party-state.
1. Key SOE Reform Milestones (2013–2023)
| Period | Reform Initiative | Efficiency Objectives | Party-State Oversight |
|---|---|---|---|
| 2013–15 | Mixed-Ownership Reform Pilots | Introduce private capital and improve market discipline and governance. | State retains controlling stakes; internal Party committees maintain strategic decision-making authority. |
| 2015–17 | “Bigger & Stronger” SOE Consolidations (e.g., Baosteel-Wuhan merger) | Realize economies of scale, reduce overcapacity and duplication. | SASAC guides mergers and oversees executive appointments to ensure alignment with state objectives. |
| 2018 | Enhanced Party Role in Corporate Governance | Strengthen accountability and align corporate strategies with Party goals. | Formal integration of Party Committees into corporate governance structures; major decisions require Party approval. |
| 2020–21 | Bond Defaults & Financial Discipline | Enforce fiscal responsibility, phasing out persistently unprofitable SOEs. | Strategic SOEs maintain implicit state guarantees; selective bailouts continue. |
| 2021–23 | Regulatory Crackdowns (Ant, Didi, Big-Tech fines) | Manage financial risks and ensure private-sector alignment with national security. | Tightened Party oversight over private sector activities, emphasizing strategic control over market-driven expansion. |
2. Structural Outcomes and Core Tensions
Hybridized Governance:
- SOE governance reforms have combined professional management and market-oriented mechanisms with strengthened Party control. Party Committees retain decisive influence on strategic, financial, and management decisions, ensuring alignment with state priorities.
Moderate Efficiency Gains:
- Mixed-ownership and improved governance have modestly increased SOE profitability, raising the average Return on Assets (ROA) from approximately 3.2% in 2015 to around 4.0% by 2022. Despite these gains, SOE returns remain notably below the private sector average (~7%), highlighting enduring efficiency challenges.
Selective Financial Discipline:
- Increasing bond defaults indicate enhanced market discipline and reduced tolerance for chronic losses. Nonetheless, strategically vital SOEs continue receiving state support, limiting full market accountability.
State-Led Innovation:
- SOEs now account for 25-30% of China’s national R&D expenditure, driving strategic initiatives in technology and infrastructure. While these efforts bolster China’s technological capabilities, innovation primarily aligns with state-driven goals rather than broader market-driven consumer needs, constraining overall economic dynamism.
Bottom Line:
China’s SOE reforms since 2013 illustrate a delicate balance between increasing corporate efficiency and maintaining strategic Party-state control. Although governance reforms have somewhat enhanced commercial performance, entrenched political oversight continues to restrict the full realization of market-driven innovation and productivity growth, limiting broader economic dynamism.
In conclusion, the “State’s Shadow” profoundly shapes China’s economic landscape. The persistent dominance of SOEs, fueled by preferential resource allocation and intertwined with the Party’s political objectives, creates structural barriers that misallocate capital, curb private sector dynamism, and entrench an investment-heavy growth model. While the Party-state clearly recognizes the need for greater efficiency and innovation, its approach to reform is heavily conditioned by the imperative to maintain control. This fundamental tension between economic optimization and political primacy is a core reason why rebalancing towards a more sustainable, consumption- and innovation-led economy proves so arduous. The path chosen will determine whether China can truly unleash its full productive potential or remain constrained by the inefficiencies inherent in its current state-market configuration, a theme that leads into the challenges of internal mobility and demographic pressures explored in Chapter 5.
5. The Walls Within: Mobility Barriers, Land Restrictions, and the Looming Demographic Drag
How do internal mobility barriers like the Hukou system and land restrictions limit urbanization’s potential to boost consumption and allocate labor efficiently, especially in an era of demographic headwinds?
The preceding chapters have dissected the multifaceted challenges hindering China’s economic rebalancing, from suppressed household consumption and debt-laden investment to the pervasive influence of state-owned enterprises. Compounding these issues are deep-seated structural rigidities related to population mobility, land rights, and an increasingly challenging demographic landscape. These “walls within”—the Hukou (household registration) system and restrictive rural land tenure—have historically constrained the full economic potential of China’s massive urbanization. They limit the efficient allocation of labor, suppress migrant consumption, and, critically, interact with a rapidly unfolding demographic shift characterized by an aging population and a shrinking workforce. This confluence of factors poses a fundamental threat to long-term productivity growth and the viability of rebalancing towards a more sustainable, internally driven economic model.
The Hukou system, a legacy of the planned economy era designed to control population movement, remains a significant impediment despite decades of reform. It assigns citizens a registered place of residence (rural or urban) which historically dictated access to employment, social services, and welfare benefits. While market forces have driven hundreds of millions of rural residents to seek work in urban centers, many do so without obtaining a local urban Hukou. As of the early 2020s, China’s “floating population” of internal migrants—those residing and working in cities without local registration—numbered between 250 to 300 million. This substantial segment of the urban workforce faces significant disadvantages:
- Unequal Access to Public Services: Migrants without local urban Hukou typically encounter restricted or inferior access to public education for their children, public healthcare, subsidized housing, and comprehensive social security (pensions, unemployment benefits) compared to registered urban residents. This creates a two-tiered system within cities.
- Suppressed Consumption: The lack of social security and perceived impermanence compels migrant households to maintain significantly higher precautionary savings rates. Denied the full benefits of urban citizenship, they save for healthcare emergencies, their children’s often more costly education (sometimes requiring them to be sent back to rural hometowns), and old-age support, directly reducing their current consumption levels.
- Inefficient Labor Allocation: While not halting migration, the Hukou system can distort labor markets. It may discourage migrants from investing in location-specific skills or making long-term career commitments in cities where their status is insecure. This can lead to labor market segmentation, wage disparities, and suboptimal allocation of human capital, particularly as the overall workforce begins to shrink. While Hukou reforms have been implemented, they have often been incremental, favoring highly skilled individuals or focusing on smaller cities, leaving significant barriers in place for the majority of migrants, especially concerning access to top-tier cities.
Data Box 5.1: The Hukou Wall – Fiscal Costs and Structural Benefits
This box quantifies the immediate (CAPEX) and ongoing (OPEX) fiscal challenges associated with fully integrating China’s migrant workforce into urban welfare systems. It also highlights the sustained consumption benefits, clarifying the economic necessity of comprehensive hukou reform amidst demographic pressures.
1. Migrant Population and Current Welfare Gaps (2024)
| Migrant Group | Population (million) | Residency Location | Key Welfare Gaps |
|---|---|---|---|
| Urban-district migrants | 132 | Major urban districts | Limited pension portability, restricted public housing, constrained education access |
| Peri-urban & county migrants | 100 | Smaller cities and towns | Basic health and education only; no advanced urban welfare |
| Rural-to-rural migrants | 68 | Rural areas | Fully reliant on rural safety nets |
2. Income and Consumption Patterns (2023)
| Indicator | Urban Residents (avg.) | Urban-district Migrants (avg.) |
|---|---|---|
| Disposable Income | CNY 51,821 (net) | CNY 51,600 (net est.) |
| Consumption Ratio | ≈ 60% | ≈ 52% |
| Consumption Gap | — | –8 percentage points |
(Source: NBS, adjusted migrant income figures.)
3. Immediate Fiscal Costs (CAPEX)
| Migrant Group | Cost per Migrant (CNY) | Total Upfront Cost |
|---|---|---|
| 132m urban-district migrants | ≈ 90,000 | ≈ CNY 12 trillion |
| Remaining 168m migrants | ≈ 48,000 (average) | ≈ CNY 8 trillion |
| Total (300m migrants) | ≈ 66,000 (weighted avg.) | ≈ CNY 20 trillion (~14% GDP) |
(Sources: IMF, Rhodium Group; covers essential infrastructure: schools, hospitals, pensions, housing.)
4. Annual Fiscal Costs (OPEX)
| Service Category | Annual Fiscal Impact (% GDP) |
|---|---|
| Additional education | ≈ 0.98% |
| Additional healthcare | ≈ 0.15–0.16% |
| Additional pension | ≈ 0.10–0.15% |
| Total annual OPEX | ≈ 1.2–1.3% (urban migrants); ≈ 1.5–2.5% (all migrants) |
(Source: Updated World Bank estimates.)
5. Consumption Benefits (Annual Gains)
| Reform Scenario | Extra Consumption/Year | Annual GDP Lift |
|---|---|---|
| Closing 8 ppt gap (132m urban) | ≈ CNY 0.54 trillion | ≈ 0.4 ppt |
| Closing gap fully (300m migrants) | ≈ CNY 1.24 trillion | ≈ 1.0 ppt |
Note: Initial CAPEX (~14% GDP) recoverable within 20–30 years from incremental consumption alone.
6. Progress and Constraints (2015–2024)
| Reform Policy | Achievements | Persistent Constraints |
|---|---|---|
| Residence permit expansion | Basic services access (>100m) | No equal pensions or full housing rights |
| Tier-2 city hukou relaxation | Skilled migrant inflows improved | Strict quotas persist in top-tier cities |
| 14th FYP service portability | Central policy commitment | Weak fiscal redistribution across provinces |
| Rural land tenure reform | Rural safety net preserved | Limits permanent urban relocation |
Structural Perspective:
China’s hukou system embodies a critical structural tension: local governments face substantial fiscal burdens when fully integrating migrants, yet comprehensive reform offers significant macroeconomic benefits. Achieving full integration boosts consumption, improves labor allocation, enhances productivity, and addresses demographic challenges. Fiscal alignment between central and local governments, through innovative fiscal frameworks and revenue-sharing arrangements, becomes essential. Without such reforms, entrenched economic inefficiencies and social disparities persist, undermining China’s long-term economic rebalancing goals.
Bottom Line – More than a Consumption Boost
The direct consumption gain (≈ 0.4–1 ppts of GDP each year) is only the first‑order payoff. Comprehensive hukou reform would also:
- Raise productivity: Permanent urban settlement lets workers move into higher‑value service and tech jobs, while freeing rural land for larger‑scale, mechanised farming.
- Deepen the service economy: Lower precautionary savings and greater job security expand demand for housing, education, health, and leisure—multiplying growth beyond the initial consumption bump.
- Broaden the tax base: Higher urban wages and formal employment increase PIT and VAT receipts, helping to recoup fiscal outlays and stabilise local‑government finances.
- Mitigate demographic drag: Better matching of labour to high‑productivity cities offsets part of the growth slowdown from an ageing and shrinking workforce.
- Enhance social cohesion: Reducing the two‑tier welfare divide lowers migrant remittances, boosts urban spending, and dampens inequality‑driven unrest.
Taken together, these second‑round effects could add an additional ½–1½ ppts to annual GDP growth over the medium term and improve long‑run fiscal sustainability. The policy hurdle is who pays: without a durable central‑local revenue‑sharing formula, local governments will continue to delay full integration despite the clear macro‑economic upside.
Intertwined with the Hukou system are restrictions concerning rural land rights. Rural land in China is collectively owned, with households holding usage rights. However, farmers typically cannot freely sell, transfer, or mortgage their contracted rural land in a way that would allow them to fully capitalize these assets to finance a permanent move to urban areas or invest in urban property. This system:
- Discourages Permanent Urban Settlement: Migrants often retain their rural land as a form of social security or last resort, hindering full commitment to urban life and perpetuating a cycle of temporary migration or split families.
- Limits Capital for Urban Integration: The inability to use rural land as significant collateral restricts migrants’ access to capital needed for urban housing down payments or entrepreneurial ventures in cities.
- Impedes Agricultural Modernization: Fragmented land holdings and restrictions on transferability can slow down agricultural consolidation, large-scale farming, and productivity improvements in the rural sector, potentially delaying the efficient release of labor to more productive urban industries.
These existing structural barriers related to labor mobility and land are now being amplified by a profound demographic shift that acts as a significant drag on China’s long-term growth potential. After decades of benefiting from a “demographic dividend” of a young and expanding workforce, China is facing:
- Rapid Population Aging: The proportion of elderly citizens is increasing sharply, while the working-age population has been shrinking since the mid-2010s.
- Persistently Low Fertility Rates: Despite the abolition of the one-child policy, birth rates remain far below replacement levels, ensuring further aging and workforce decline in the coming decades.
- Rising Dependency Ratios: A smaller working population must support a growing number of retirees, straining pension and healthcare systems and potentially impacting national savings and investment patterns.
This demographic drag has critical macroeconomic implications. A shrinking labor force directly limits one of the key inputs for economic growth. To maintain a desired level of GDP growth, China must achieve significantly higher productivity gains from its existing and future workforce. Furthermore, an aging society typically sees shifts in consumption patterns and an increased demand for healthcare and elderly care services, requiring substantial fiscal resources and potentially altering national savings behavior. The pressure to enhance human capital quality—through better education, healthcare, and lifelong learning—becomes paramount as a compensatory mechanism for declining labor quantity.
Data Box 5.2: China’s Demographic Squeeze: The Productivity Imperative
China faces a historic demographic transition characterized by a shrinking workforce, rapid aging, and persistent structural barriers to rebalancing from investment toward consumption. Given mounting debt burdens, declining investment efficiency, and sluggish consumption growth, substantial increases in total-factor productivity (TFP) are essential for maintaining sustainable growth above 3%. This box quantifies these demographic and productivity challenges, highlighting the critical need for economic reform.
1. Demographic Trends and Pressures
| Metric | 2010 | 2024 | 2035 (est.) |
|---|---|---|---|
| Population aged 65+ (% of total) | 9% | 14% | 25% |
| Working-age share (15–64 years, % of total) | 73% | 69% | 67% |
| Annual workforce change (million/year) | +1.7m | –1.5m | –4.9m (avg.) |
| Total fertility rate (births per woman) | 1.7 | 1.3 (policy target) |
(Sources: UN World Population Prospects 2024; World Bank; China NBS Census.)
The rapidly shrinking workforce—projected to contract by approximately 4.9 million annually in 2035—and persistently low fertility rates underscore China’s intensifying demographic pressures.
2. Ageing and Economic Context
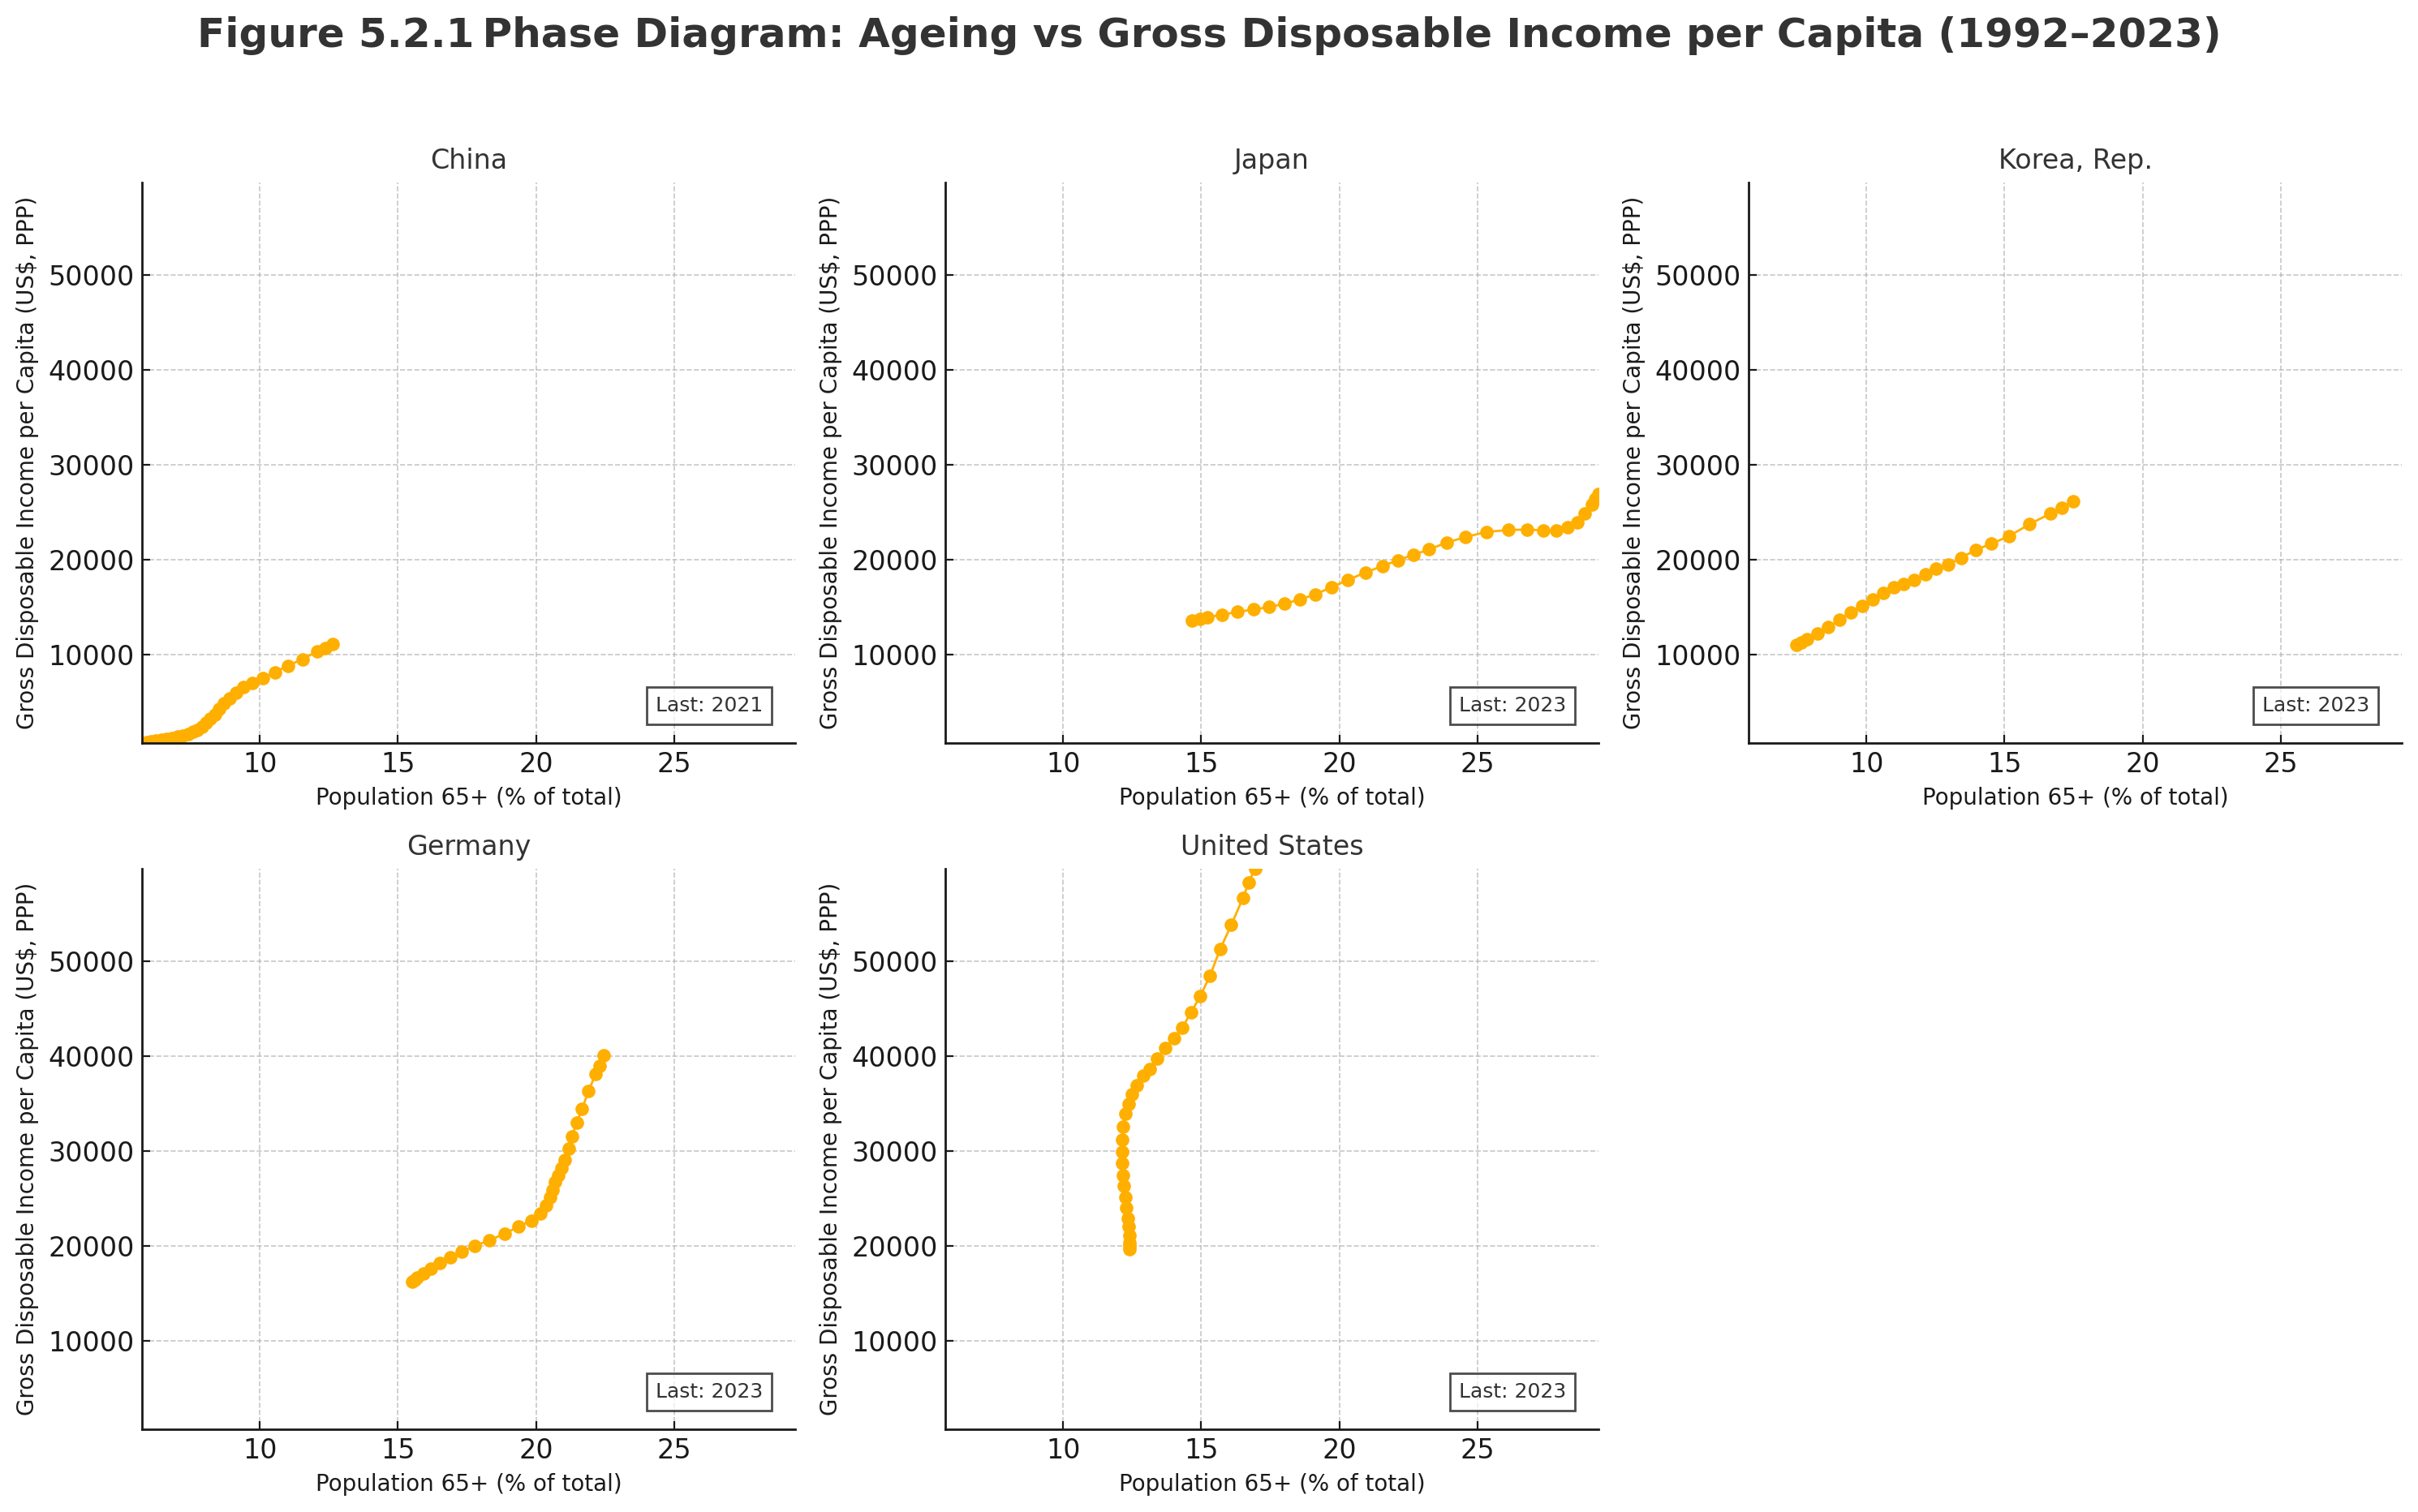


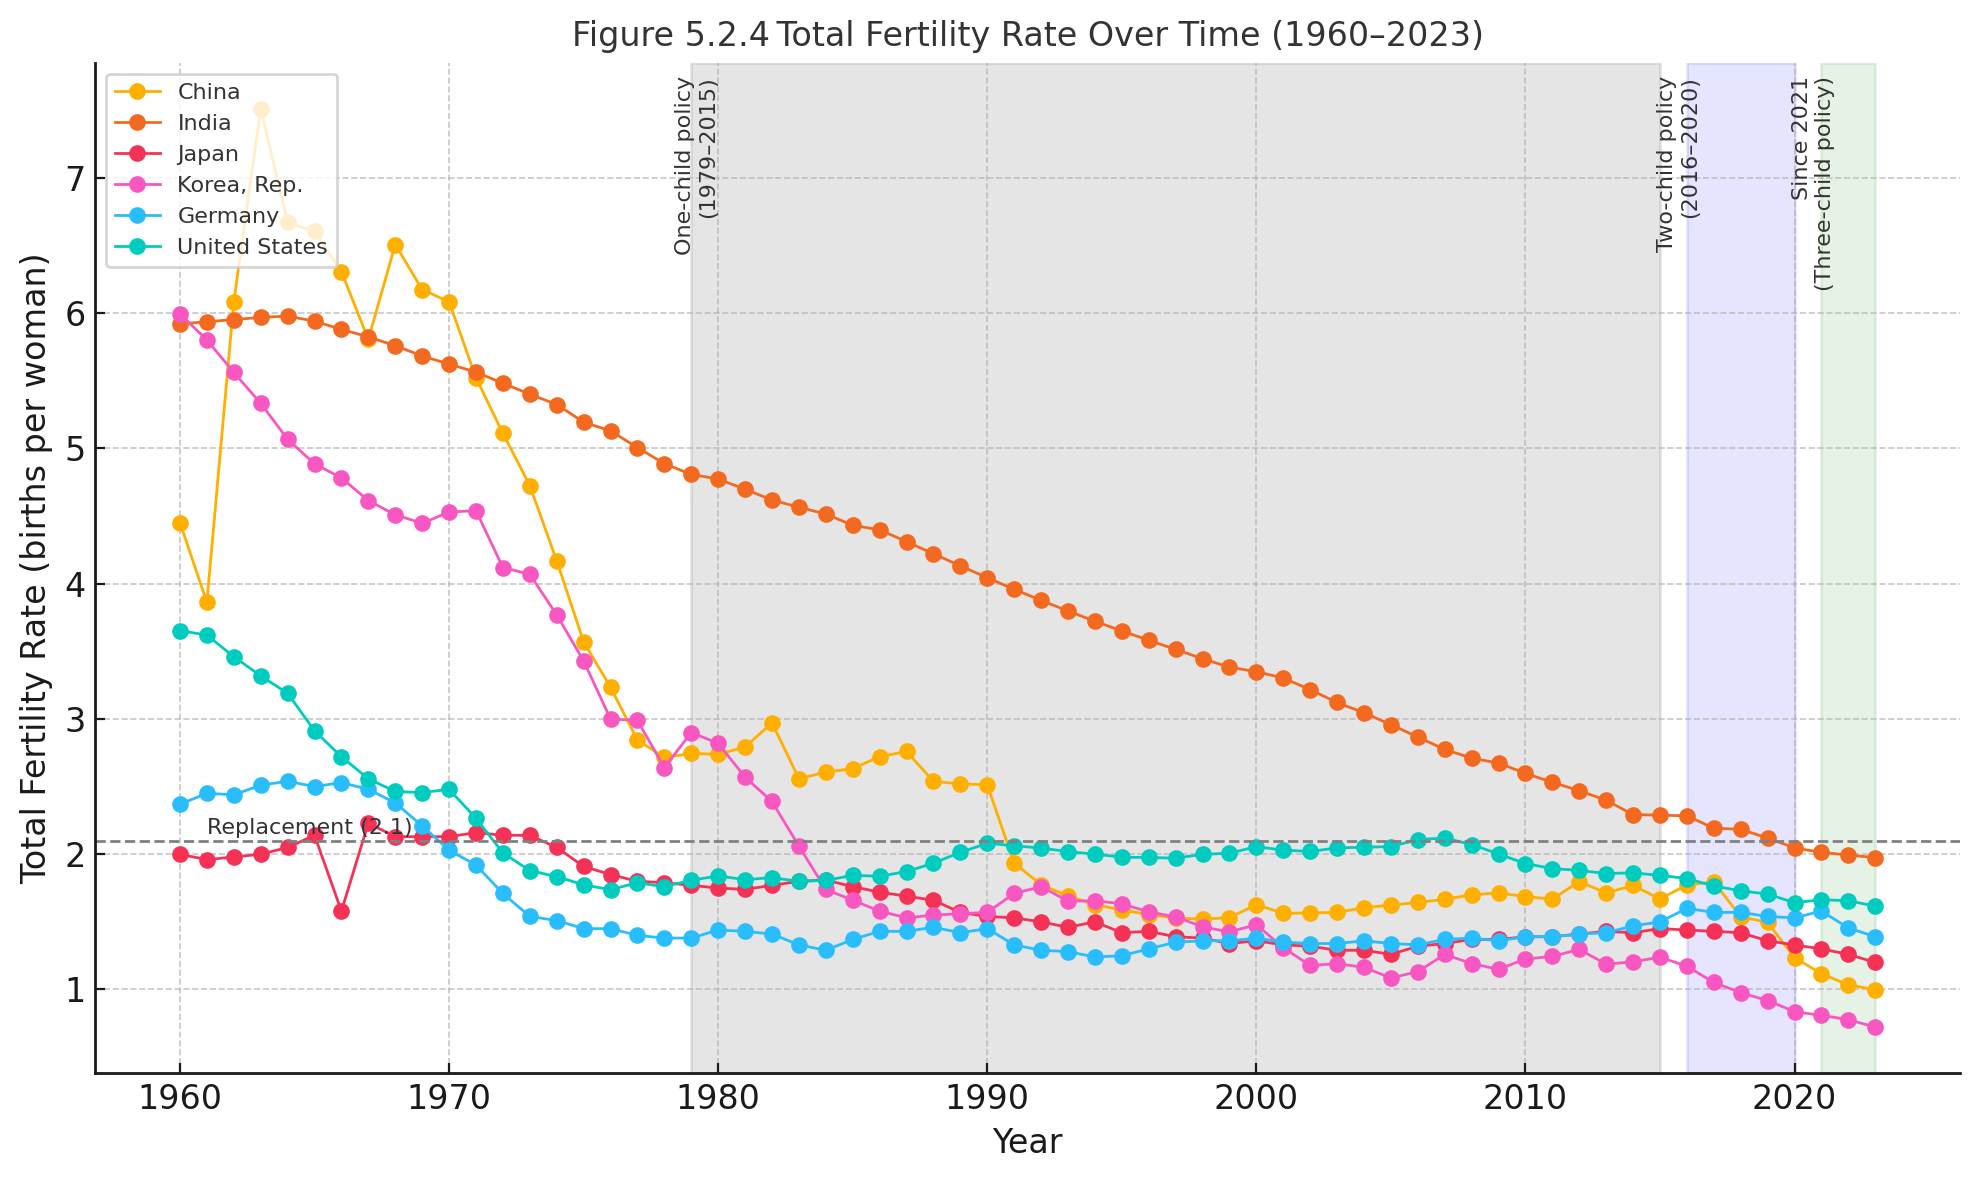
- Income vs. Ageing: China reached an aged society status (≥14% population aged 65+) before achieving high-income status (per capita GDP around nominal US$14,005). Rapid ageing creates increasing fiscal demands and limits economic flexibility.
- Old-Age Dependency: The ratio of retirees to working-age individuals is rising rapidly, amplifying fiscal strain and reinforcing the urgency for productivity-driven growth.
- Fertility Policy Effectiveness: Despite shifting from one-child to three-child policies, fertility remains stubbornly low, exacerbating demographic challenges.
Sources: World Bank; UN Population Prospects.
3. Productivity Needs for Sustainable Growth
GDP growth decomposition (average 2015–2022):
| Growth Component | Contribution (ppt) |
|---|---|
| Labour quantity (ΔL) | –0.2 |
| Capital deepening (α ΔK) | +2.7 |
| TFP required to achieve: | |
| – 5% GDP growth | +2.5 |
| – 4% GDP growth | +1.5 |
| – 3% GDP growth | +0.5 |
| – 2% GDP growth | –0.7 |
As labour contracts and investment efficiency declines, achieving stable growth of 3–4% necessitates TFP growth rates significantly above recent historical averages.
4. Future Productivity Stress-Test (2024–2033)

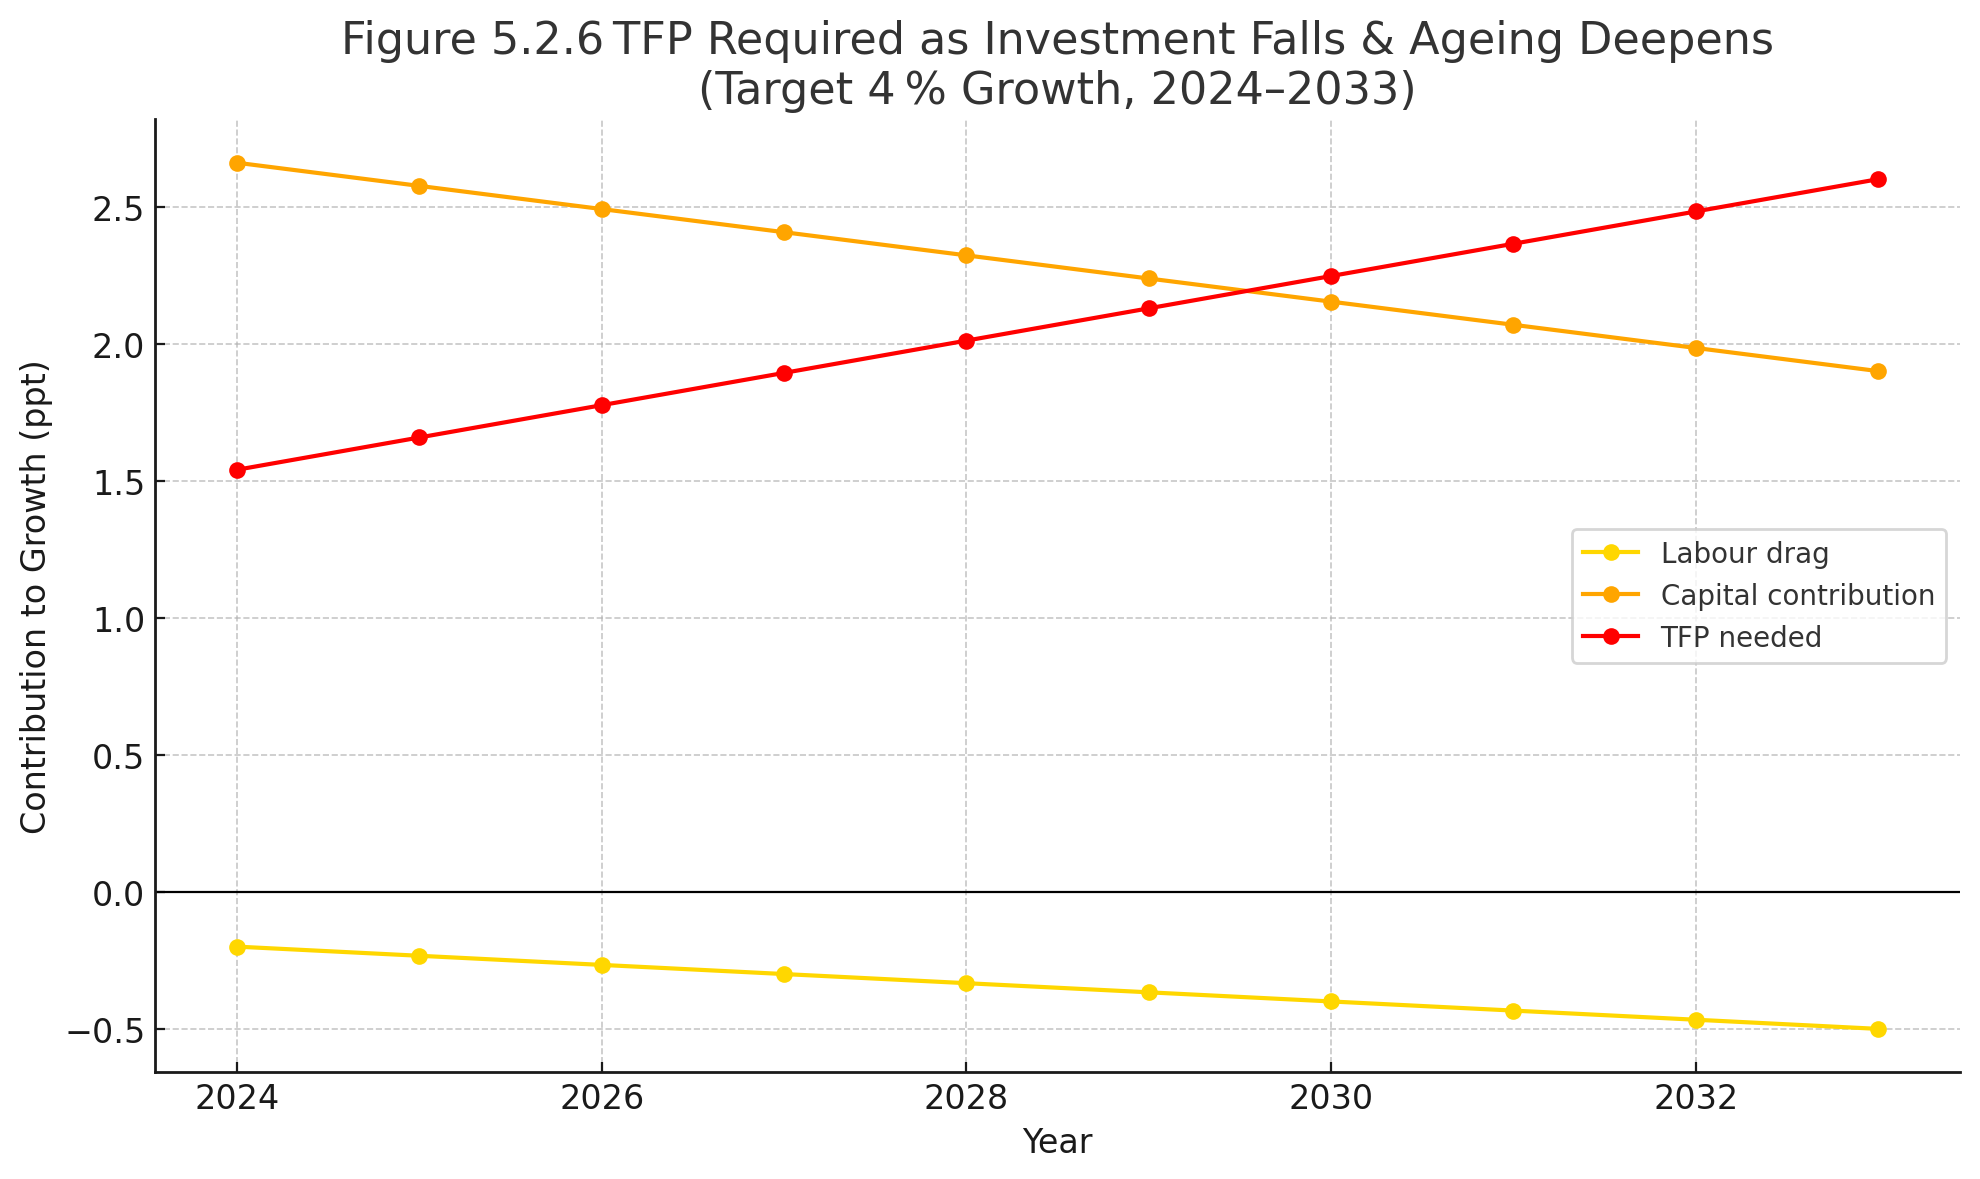
Under scenarios of deepening demographic challenges (–0.5 ppt annual labour reduction) and decreasing investment (from 42% to 30% of GDP), TFP improvements required for a steady 4% growth rate rise sharply:
- 2024: ~1.5 ppt TFP increase
- 2033: ~2.6 ppt TFP increase
These dynamics underline the urgency for accelerated productivity reforms.
5. Historical Context: Declining TFP Growth
| Period | Capital Contribution | Human Capital Contribution | TFP Contribution | Output per Worker |
|---|---|---|---|---|
| 1979–88 | 2.7 ppt | 0.6 ppt | 3.4 ppt | 6.7 ppt |
| 1989–98 | 3.5 ppt | 0.7 ppt | 2.5 ppt | 6.7 ppt |
| 1999–08 | 5.8 ppt | 0.4 ppt | 2.8 ppt | 9.0 ppt |
| 2008–18 | 6.1 ppt | 0.5 ppt | 0.6 ppt | 7.2 ppt |
(Source: World Bank Policy Research Working Paper No. 9298.)
Interpretation guide: “Output per Worker” is labour‑productivity growth—the sum of the capital, human‑capital, and TFP columns.
Headline GDP growth = Output per Worker + Labour‑force growth
Example: 1999‑2008 productivity rose 9 ppt and the workforce grew about +1 ppt, yielding overall GDP growth near 10 ppt—matching official data. Today the labour‑force term has turned negative, so almost all future GDP growth will have to come from faster TFP gains.
Since 2008, annual TFP growth has fallen significantly, averaging below 1 ppt post-2015, precisely when demographic and economic challenges necessitated stronger productivity growth. Increased reliance on capital accumulation highlights diminishing returns and underscores the need to prioritize productivity-enhancing investments.
6. Structural Challenges Amplified by Demographics
| Constraint | Ageing-related Risks | Required Productivity and Policy Reforms |
|---|---|---|
| Debt overhang | Smaller workforce weakens fiscal base | SOE reform, fiscal discipline, market efficiency |
| Investment inefficiency | Labour scarcity raises capital misallocation costs | Capital-market reforms, investment in high-return sectors (services, technology, green industries) |
| Hukou/social protection | Higher urban welfare costs; suppressed consumption growth | Unified national social-security system, improved portability |
Bottom Line – Productivity as Economic Lifeline
China confronts a demographic triple bind: a shrinking workforce, structural impediments to consumption growth, and diminished returns from investment-led expansion. To avoid prolonged economic slowdown, substantial acceleration in productivity (TFP) growth—well above recent historical trends—is essential. Achieving this requires comprehensive reforms targeting capital allocation efficiency, innovation capacity, human capital investment, and enhanced consumption. Without these transformative shifts, China risks becoming trapped in structurally lower and more fragile growth, jeopardizing its long-term economic stability and resilience.
The confluence of restrictive Hukou and land systems with these mounting demographic headwinds presents a formidable challenge to China’s rebalancing. Optimizing the allocation and productivity of every worker is crucial in an era of a shrinking labor pool. However, barriers that prevent individuals from moving to where their skills are most valued, or from fully integrating and consuming as urban citizens, directly counteract this imperative. Moreover, the fiscal strains imposed by an aging population may further complicate local governments’ willingness or ability to absorb the costs associated with comprehensive Hukou and land reforms. Addressing these intertwined “walls within” requires not only technically sound policies but also navigating significant political and fiscal trade-offs, underscoring the deep structural nature of the obstacles to China achieving sustainable, high-quality, and balanced growth. The way China manages these internal constraints will significantly influence its capacity to address the external pressures and global ripple effects discussed in the subsequent points.
6. Global Ripples: Internal Imbalances, External Tensions, and Geoeconomic Statecraft
How do China’s internal imbalances (e.g., industrial overcapacity driven by investment) spill over externally, causing trade friction and forcing China to reshape global value chains?
The structural fault lines within China’s economy—its suppressed household consumption, reliance on debt-fueled and often inefficient investment, state-dominated resource allocation, and internal mobility constraints—as detailed in the preceding chapters, do not exist in a vacuum. Given China’s sheer scale and its deep integration into the global system, these internal imbalances inevitably generate significant external spillovers. The persistent tendency for domestic savings to exceed domestic investment (S>I), coupled with a state-directed push to build vast industrial capacity, translates into powerful outward pressures. These “global ripples” manifest primarily as recurrent industrial overcapacity leading to export surges and trade friction, a strategic impetus for China to reshape global value chains (GVCs) to its advantage, and the deployment of a sophisticated array of geoeconomic tools to secure its national interests and project influence on the world stage.
A primary and recurring external consequence of China’s internal economic model is the phenomenon of large-scale industrial overcapacity. The investment-led growth strategy, amplified by readily available credit from state banks and ambitious local government targets for GDP expansion, has frequently resulted in the creation of production capabilities far exceeding sustainable domestic demand in numerous sectors. Historically, this pattern was starkly evident in foundational industries such as steel, aluminum, shipbuilding, and cement, where Chinese output eventually saturated domestic markets and then flooded global markets, often depressing international prices and leading to accusations of dumping (selling goods abroad below production cost or domestic prices). More recently, similar dynamics are observable in newer, strategically prioritized sectors. China’s dominance in solar photovoltaic manufacturing, for example, where it accounts for over 80% of global capacity across the supply chain, and its rapidly expanding capacity in electric vehicles (EVs) and batteries, projected to significantly outstrip even its large domestic demand, illustrate this ongoing trend. This structural overcapacity necessitates a substantial export push to absorb surplus production, maintain employment levels, and achieve returns on the massive capital invested. While this can offer global consumers access to lower-cost goods and accelerate the adoption of new technologies like EVs and renewables, it invariably leads to heightened trade friction and disputes with established industrial economies. These nations voice concerns that China’s extensive state subsidies, preferential financing for state-linked enterprises, and other industrial policy measures create an uneven playing field, enabling Chinese firms to undercut international competitors and threaten the viability of their own domestic industries. This has led to a proliferation of anti-dumping investigations, countervailing duties, and other trade defense measures by countries seeking to protect their markets.
Data Box 6.1: Industrial Overcapacity: Diagnosis, Dynamics, and the China Benchmark
Industrial overcapacity is critical to understanding China’s complex economic and geopolitical dynamics. This box clarifies how to define and diagnose overcapacity, explores conditions under which excess capacity may be beneficial or harmful, provides insights from pivotal green-tech sectors, and outlines the broader implications for international trade and policy-making.
1. Defining Industrial Overcapacity
Overcapacity occurs when industry production capacity persistently exceeds profitable, market-clearing demand (domestic and export combined) throughout a typical investment cycle (~3–5 years). Any two persistent indicators below likely signal structural overcapacity.
| Diagnostic lens | Indicator | Red-flag threshold |
|---|---|---|
| Utilisation | – Annual average capacity-use (%) – Tracks idle lines and downtime across facilities | Sustained < 80% for ≥ 3 years |
| Margin squeeze | – Sector profitability: EBIT or ROA margins – Reflects full financial performance (incl. depreciation, financing costs, taxes) | Negative margins for ≥ 2 consecutive years |
| Price distortion | Selling price (domestic or export) vs “full economic cost”: • Cash cost of production • + subsidy equivalent (grants, tax breaks, cheap finance, land/power discounts) • + normal return on invested capital (ROIC) | Price >10% below full economic cost for ≥ 3 consecutive quarters |
| Subsidy reliance | Total state-support intensity: • Direct subsidies (grants, tax rebates) • Implicit “negative-cost” finance (below-market state-bank lending) • In-kind support (land, utilities) | Subsidy burden >10% of revenues (or rising) while utilisation ≤80% |
Rationale:
– Utilisation reveals actual production slack.
– Margin squeeze indicates systemic profitability issues.
– Price distortion identifies harmful price suppression before margins collapse.
– Subsidy reliance shows how support masks inefficiency or creates unfair competitive advantages.
2. Beneficial vs Harmful Overcapacity
| Scenario | Potentially Beneficial | Becomes Harmful When |
|---|---|---|
| Scale-up learning | Accelerates global technology diffusion (e.g., renewables) | Excess destroys competitors prematurely |
| Cyclical buffer | Stabilizes prices during demand shocks | Persistent slack locks capital in unproductive assets |
| Resilience capacity | Provides strategic redundancy (e.g., semiconductors, vaccines) | Surplus capacity becomes geopolitical leverage |
| Competitive discipline | Enhances efficiency through healthy competition | Below-cost pricing triggers harmful subsidy competition |
3. Sector Deep-Dives: Evidence from Key Industries
Each deep-dive provides nuanced perspectives on China’s overcapacity dynamics across strategically critical sectors.
3.1 | Solar PV Modules (2010–2022)
| Year | Global demand (GW) | Global module capacity (GW) | Capacity/Demand ratio | China’s share of Global production (%) |
|---|---|---|---|---|
| 2010 | 24 | 32 | 1.3× | ~50% |
| 2015 | 65 | 110 | 1.7× | ~63% |
| 2018 | 104 | 185 | 1.8× | ~68% |
| 2020 | 144 | 300 | 2.1× | ~65% |
| 2021 | 195 | 400 | 2.0x | ~72% |
| 2022 | 225 | 515 | 2.3× | ~72% |
Source: IEA, Special Report on Solar PV Global Supply Chains, compiled by author (est.).
Analysis:
- Solar PV shows structural and persistent overcapacity, evidenced by sustained utilization below 50% post-2020.
- However, global consumers benefit from sharply declining module costs (80% drop over a decade), enhancing renewable energy affordability.
- Driven by provincial investment targets and low entry barriers, surplus becomes export-dependent, exacerbating trade tensions.
Figure 6.1.1 – Solar PV Subsidy Intensity: China vs. OECD (2006–2023)
(Based on OECD data: Government support in the solar and wind value chains)
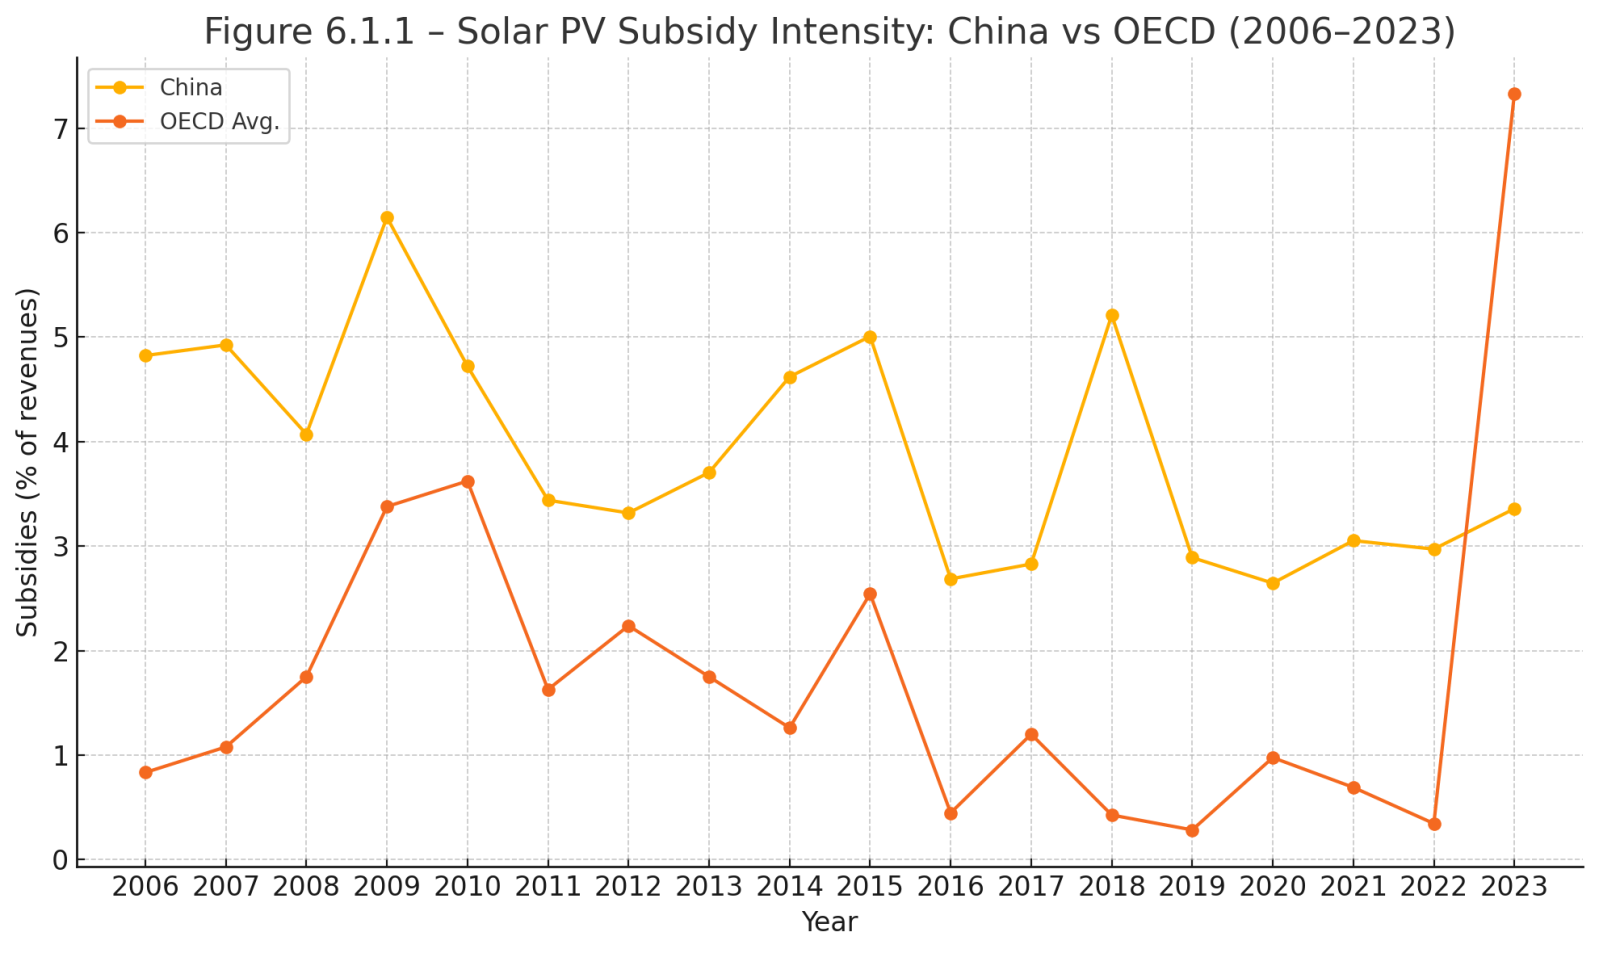
This chart tracks total subsidy burden—grants, tax concessions, and below-market financing—as a percentage of solar-PV firm revenues.
- Consistently higher in China: Averaging ~ 3.5-4% of revenues vs ~1–2% in OECD.
- Stimulus spikes: Marked rises in 2009 and 2015 reflecting stimulus packages.
- Post-2018 divergence: Although OECD subsidies rose notably in 2023 due to incentives like the U.S. IRA, China’s support remains substantially higher.
3.2 | Electric Batteries (2020–2025)
| Year | China Capacity (GWh) | Global Capacity (GWh) | China share of Global Capacity (%) | China Domestic Demand (GWh) | Global Demand (GWh) | Utilisation Rate China (%) |
|---|---|---|---|---|---|---|
| 2020 | 575 | 767 | 75% | ~ 80 | ~ 160 | |
| 2021 | ~ 650 | ~ 900 | 72% | ~ 180 | ~ 330 | |
| 2022 | ~ 900 | ~ 1200 | 75% | ~ 310 | ~ 550 | |
| 2023 | ~ 1750 | ~ 2200–2300 | ~ 73–80% | ~ 415 (China produced ~ 650 in 2023) | ~ 775 | 37% |
| 2030 (committed expansion, est.) | ~ 3750 | ~ 5800 | ~ 65% | ~ 1400 (APS scenario) | ~ 4000 (APS scenario) | |
| 2030 (committed + preliminary projects,est.) | ~ 5300 | ~ 7900 | ~ 67% | ~ 5500 (NZE scenario) |
Sources: IEA Global EV Outlook 2024; VisualCapitalist; BloombergNEF, compiled by author (est.).
- Current overcapacity is clear, with utilization still below healthy thresholds.
- But rapid demand growth in EV and stationary storage sectors may quickly absorb excess, converting overcapacity from structural to transitional.
- Strategic competition and state-led investments foster surplus, reflecting broader geopolitical ambitions rather than purely market dynamics.
3.3 | NEVs (2021–2030)
| Year | China NEV Sales (m units) | China NEV Assembly Capacity (m units) est. | Utilisation (%) est. |
|---|---|---|---|
| 2021 | 3.5 | 5.7 | 61% |
| 2022 | 6.9 | 9.5 | 73% |
| 2023 | 9.5 | 13 | 73% |
| 2024 | 12.9 | 20 | 65% |
| 2025 | 14–18 | 25 | 64% |
| 2030 | 19–25 (domestic) + exports | ≥30 |
Sources: Goldman Sachs, IEA, Reglobal, compiled by author (est.).
Analysis:
- NEV sector overcapacity is cyclical and quickly resolved, with idle capacity typically absorbed within 12–18 months due to explosive demand growth.
- Dual structure market: High utilization among market leaders contrasts starkly with less efficient firms.
- Geopolitical friction emerges primarily due to rapid export growth, heightening scrutiny on industrial subsidies and pricing practices.
4. Drivers of Persistent Chinese Overcapacity
- Investment-driven targets: “Build first, absorb later” GDP objectives.
- Provincial competition: Redundant capacity driven by local rivalry.
- Layered subsidies: Financial incentives (low-cost loans), direct grants, discounted land/energy.
- Soft budget constraints: Implicit state guarantees sustain unprofitable firms.
- Strategic ambition: Global leadership through sustained scale advantages.
5. Policy and Geopolitical Implications
Overcapacity is not inherently harmful. China’s structural excess in solar PV reflects sustained distortion, while battery and NEV sectors show more nuanced, dynamic trends. Policy implications include:
- Ensuring subsidy transparency to mitigate trade disputes.
- Credible capacity exit mechanisms to reduce market distortions.
- Aligning domestic demand growth (boosting household consumption) with capacity expansions.
Bottom line: Overcapacity is not always bad—solar panels became affordable because China over-built—but unchecked structural surpluses, sustained by subsidies and soft credit, export deflationary pressure and trigger trade conflict. A credible domestic exit policy, coupled with stronger global subsidy rules, is essential to turn China’s scale into shared prosperity rather than zero-sum contest.
Beyond direct trade spats, China’s internal economic structure and strategic ambitions are compelling a significant reshaping of Global Value Chains (GVCs). Several intertwined dynamics are at play:
- China Ascending the Value Chain: Driven by industrial policies like “Made in China 2025” and the broader goal of escaping the middle-income trap, China is no longer content with being the world’s assembly hub. It is actively seeking to move into higher value-added manufacturing, indigenous innovation, and global branding. This means Chinese firms are increasingly competing directly with companies in advanced economies in sophisticated sectors, rather than merely complementing them.
- Diversification and “De-risking” by Multinational Corporations (MNCs): Geopolitical tensions (e.g., US-China trade and tech wars), coupled with disruptions experienced during the COVID-19 pandemic and rising costs within China, have prompted many MNCs to adopt “China+1” or broader supply chain diversification strategies. This involves establishing or expanding manufacturing operations in other countries (e.g., Vietnam, India, Mexico, Thailand) to reduce over-reliance on China for critical production.
- China’s Evolving Role in GVCs: While some final assembly may shift, China often remains a crucial supplier of intermediate goods, components, and capital equipment to these new manufacturing locations. This indicates a complex re-networking and regionalization of GVCs, with China potentially solidifying its role as a central node in Asian and broader Global South production networks, even as some direct exports to the West are rerouted.
- Fostering Sino-centric GVCs: Through initiatives like the Belt and Road Initiative (BRI) and trade pacts such as the Regional Comprehensive Economic Partnership (RCEP), China is actively cultivating GVCs that are more centered around its own economy. This includes investing in infrastructure in partner countries, promoting Chinese technical standards, and increasing trade in both intermediate and finished goods, effectively fostering alternative value chains that are less dependent on traditional Western hubs.
Box 6.2 | Global-Value-Chain Reconfiguration: Drivers, Metrics & Evidence
This box elucidates why and how China-centred global value chains (GVCs) have been reshaped since the Global Financial Crisis (GFC), particularly accelerated by the US-China trade and technology conflicts. By integrating quantitative trend metrics and concise analysis, we clarify the structural economic, technological, and geopolitical drivers behind these transformations.
1. Drivers of Global Value Chain Reconfiguration
| Driver | Mechanism | Post-2018 Manifestations |
|---|---|---|
| Cost & Risk Diversification | Wage increases, tariff uncertainty, COVID-related disruptions | Production shifts to ASEAN, India, Mexico; inventory management nearer final markets |
| Strategic Industrial Policy | Made in China 2025, green-tech incentives | Upstream dominance in batteries, solar PV, electric vehicle (EV) components |
| Geopolitical De-risking | US/EU tech restrictions, friend-shoring policies (e.g., IRA, CHIPS Act) | Parallel tech ecosystems; advanced manufacturing reshored to US/EU |
| China’s Outward Economic Strategy | Belt & Road Initiative (BRI), RCEP, increased RMB settlement | Expanded Sino-centric supply hubs; increasing RMB-denominated regional trade |
| Technological Upgrading | Automation, digitalisation, rapid prototyping | Transition from final assembly to high-value components, machinery, and R&D-intensive tasks |
2 . Quantitative Metrics (2008 – 2022)
| Indicator | 2008 | 2013 | 2018 | 2022 | Trend (2008 → 2022) | Comment |
|---|---|---|---|---|---|---|
| China’s Exports by Destination Region | ||||||
| East Asia & Pacific | 36.80 % | 41.82 % | 37.83 % | 36.26 % | ↔ −0.54 pp | China’s “near-shore” market share holds steady despite supply-chain shifts. |
| Europe & Central Asia | 26.34 % | 20.16 % | 20.70 % | 22.84 % | ↓ −3.50 pp | Tariff friction offset by post-COVID demand; share still below 2008 level. |
| North America | 19.20 % | 18.04 % | 20.70 % | 17.71 % | ↓ −1.49 pp | US tariffs bite, but diversification softens the decline. |
| South Asia | 3.10 % | 3.41 % | 4.74 % | 4.87 % | ↑ +1.77 pp | Rising integration with India, Bangladesh, Pakistan value chains. |
| Latin America & Caribbean | 4.97 % | 6.03 % | 5.94 % | 7.00 % | ↑ +2.03 pp | Commodities-for-manufactures swap deepens; electronics assembly growing. |
| Middle East & North Africa | 5.20 % | 5.54 % | 5.06 % | 5.48 % | ↑ +0.28 pp | Energy-linked projects and infrastructure exports keep share flat-to-up. |
| Sub-Saharan Africa | 2.55 % | 3.05 % | 3.00 % | 3.49 % | ↑ +0.94 pp | Small base but steady climb via BRI and consumer goods. |
| Other Key Indicators | ||||||
| China inward FDI (US$ bn, net) | 108 | 124 | 138 | 189 | — | Capital still flows to China, but tech-screening has shifted toward JV/R&D formats. |
| China outward FDI (US$ bn) | 55 | 108 | 143 | 163 | — | Outflows plateau after 2016 peak; focus pivots to ASEAN and critical minerals. |
| Domestic value-added share in Chinese exports | 78 % | 81 % | 83 % | 84 % (2020) | ↑ | Reflects “moving up the chain” into components, machinery, & own-brand goods. |
| Foreign VA in US electronics imports via China | 37 % | 46 % | 46 % | 46 % (2020) | — | China still largest single foreign VA source for US hi-tech imports. |
| Foreign VA in US electronics imports via ASEAN | 10 % | 9 % | 10 % | 11 % (2020) | ↑ | ASEAN gains share, often using China-made inputs—evidence of “re-routing.” |
Sources : WITS / Customs, UNCTAD WIR 2024, OECD TiVA.
3. Key Visual Evidence
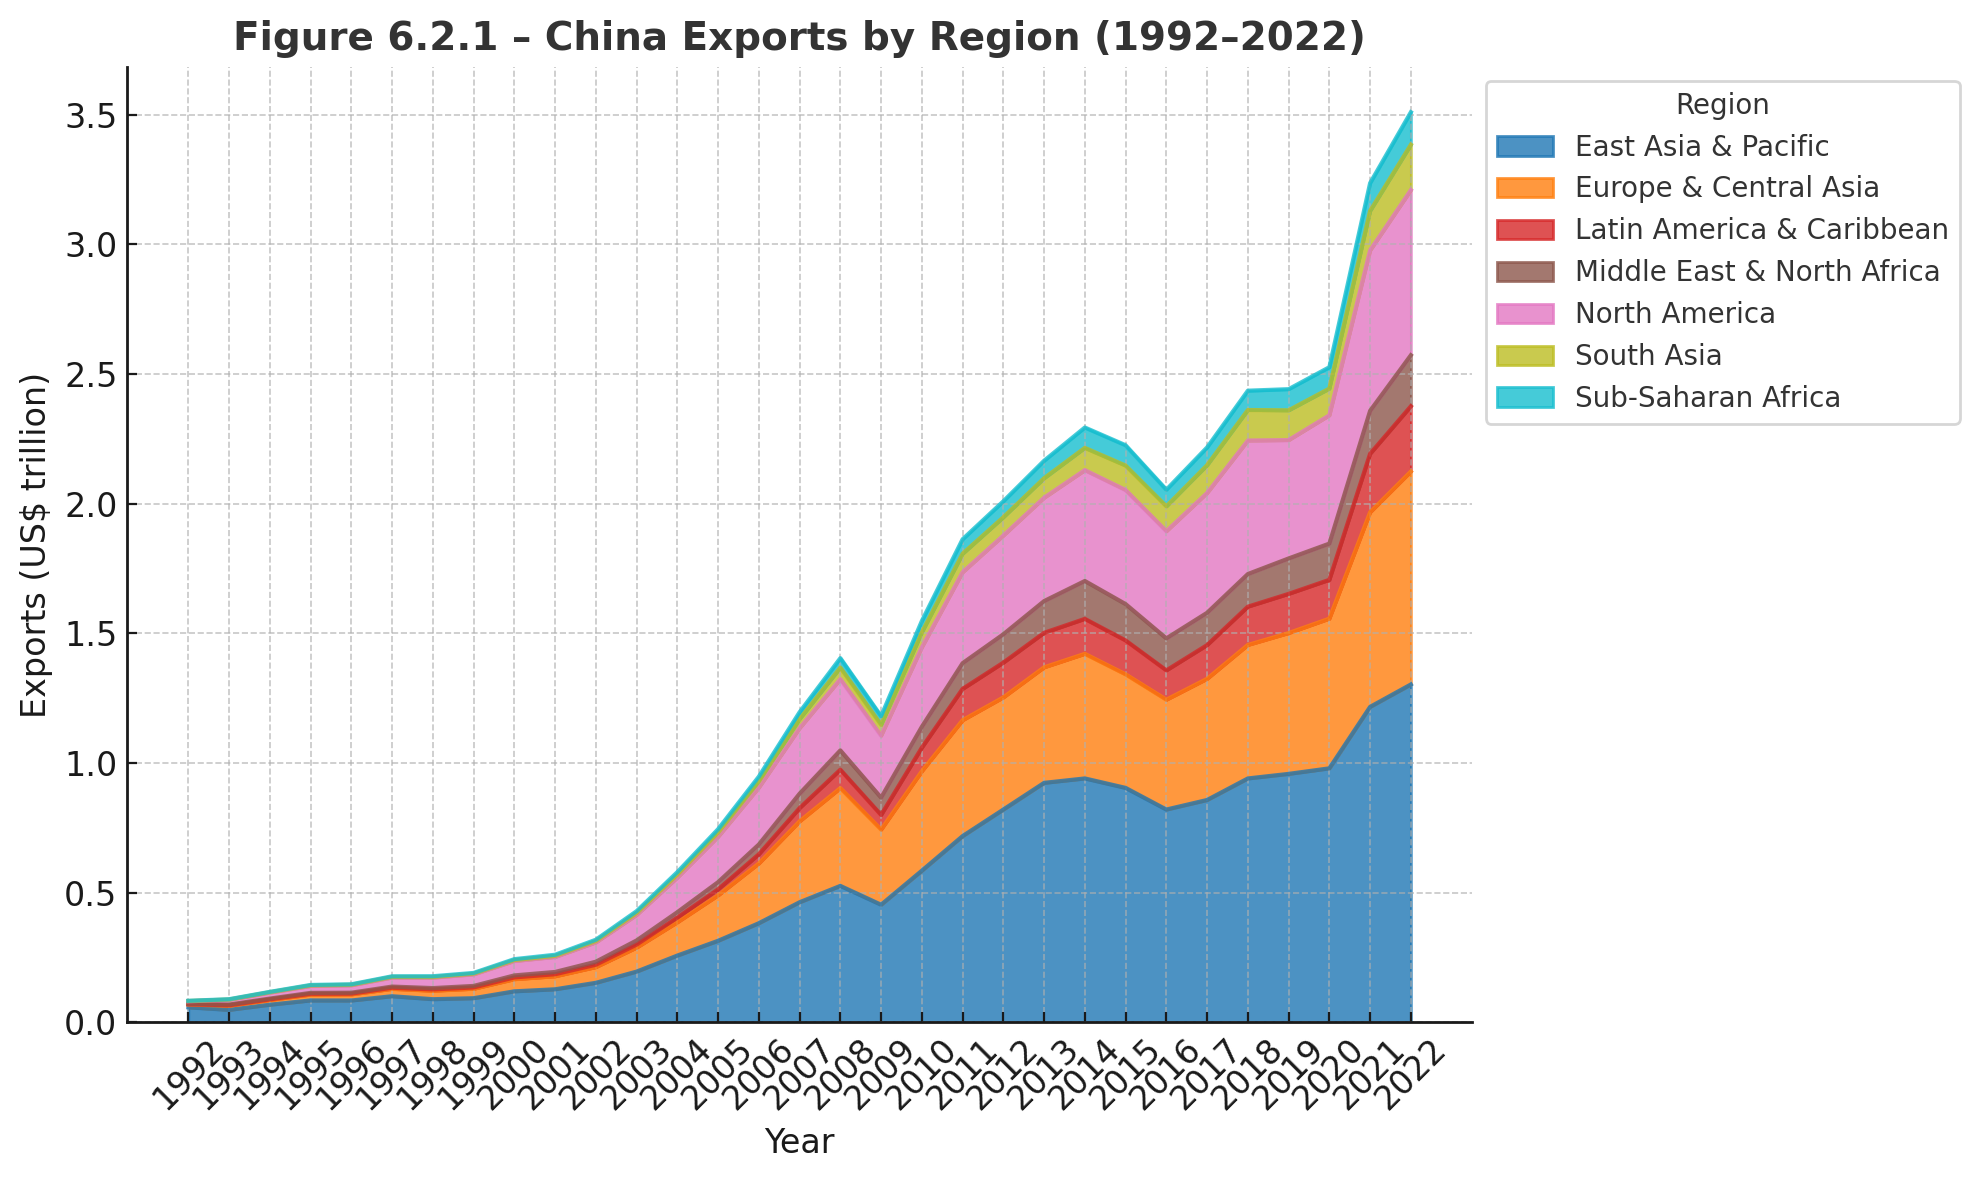
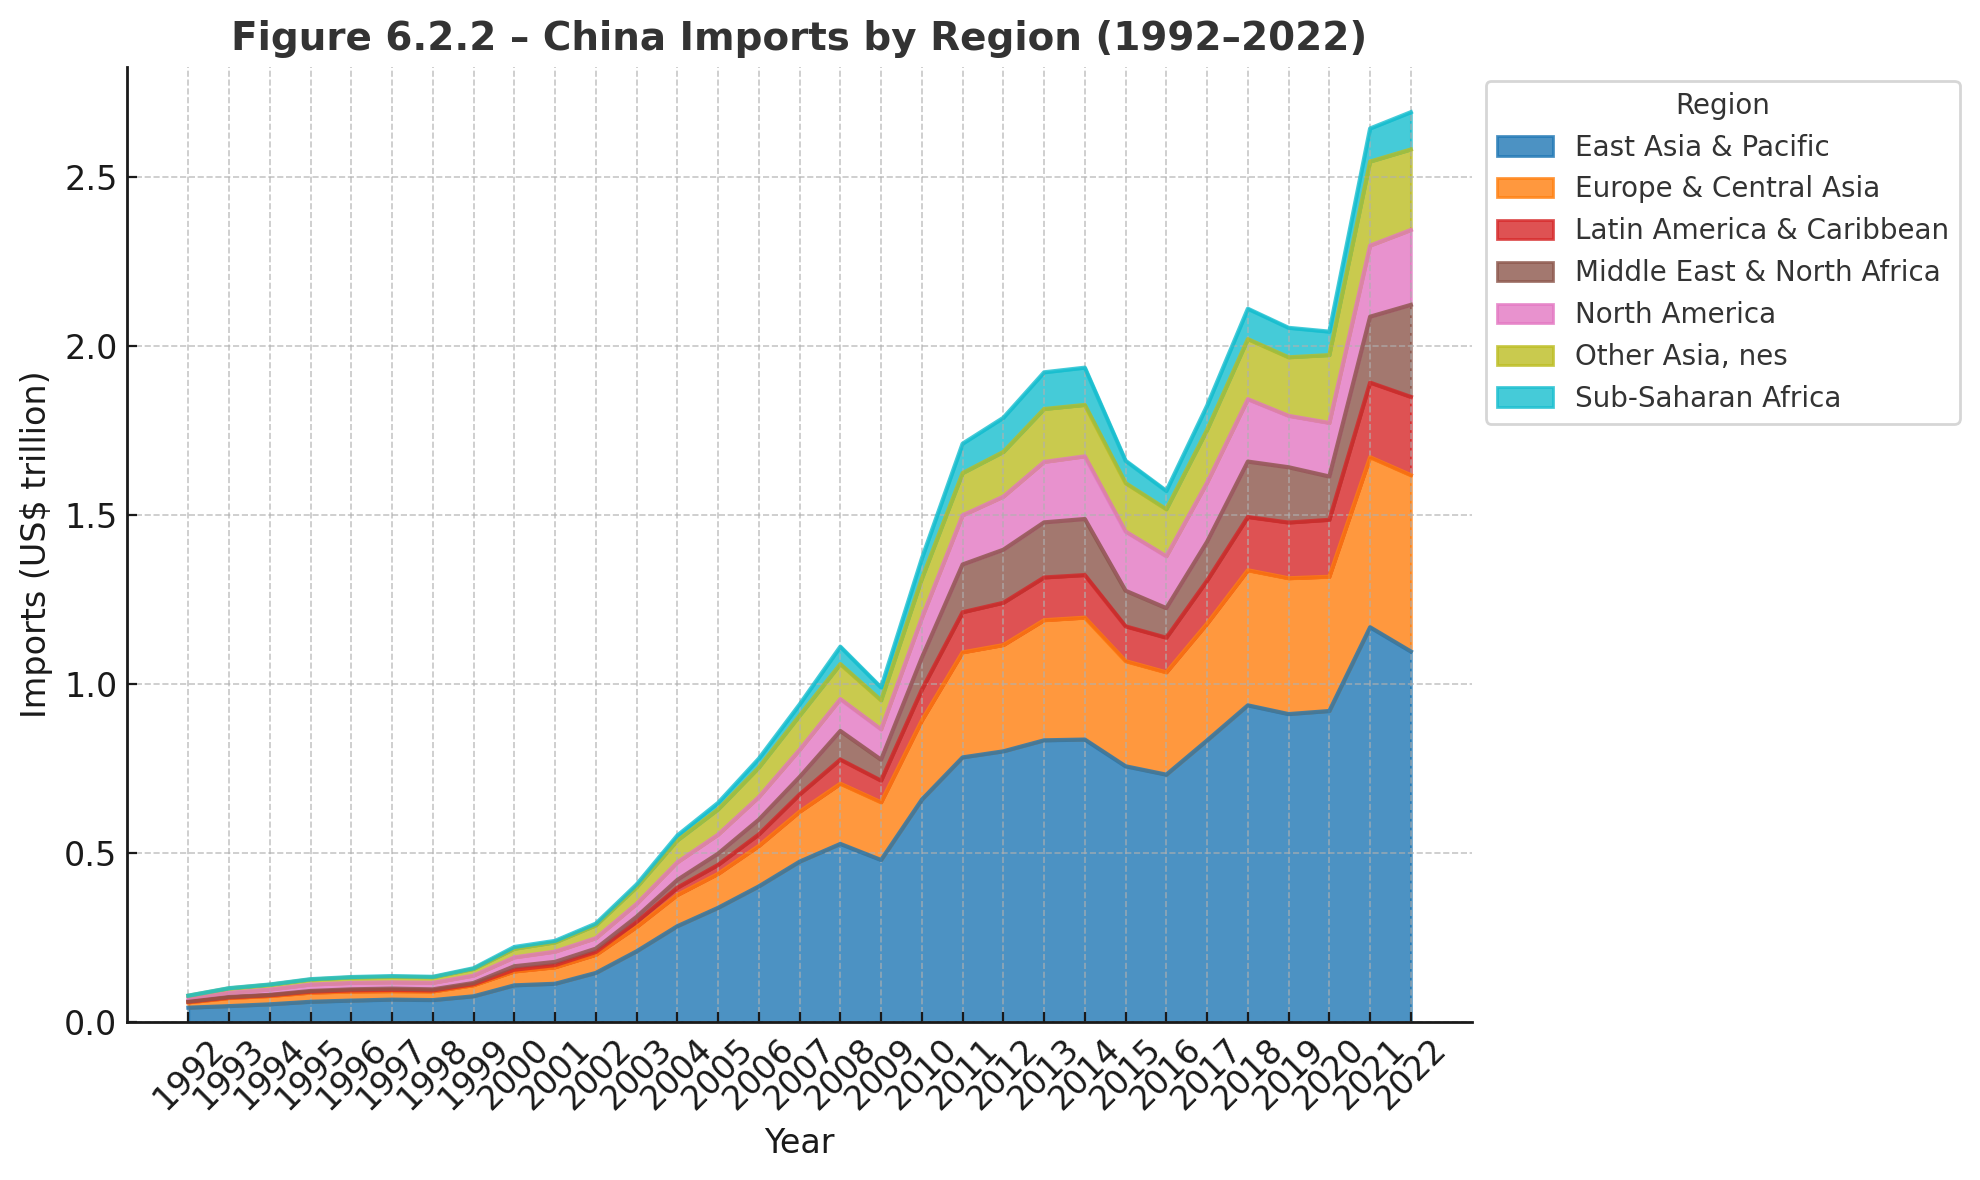
Figures 6.2.1 & 6.2.2 — What the twin charts show
China’s export and import stacks tell the same story: regional diversification without departure. East Asia stays the anchor for both outbound sales and intermediate-goods sourcing, while Europe/North America shrink only modestly and shares for ASEAN, South Asia, Latin America, and resource-rich MENA/Africa edge up. The result is a wider geographic spread atop ever-larger absolute flows—evidence that global supply chains are rerouting around China, not away from it.
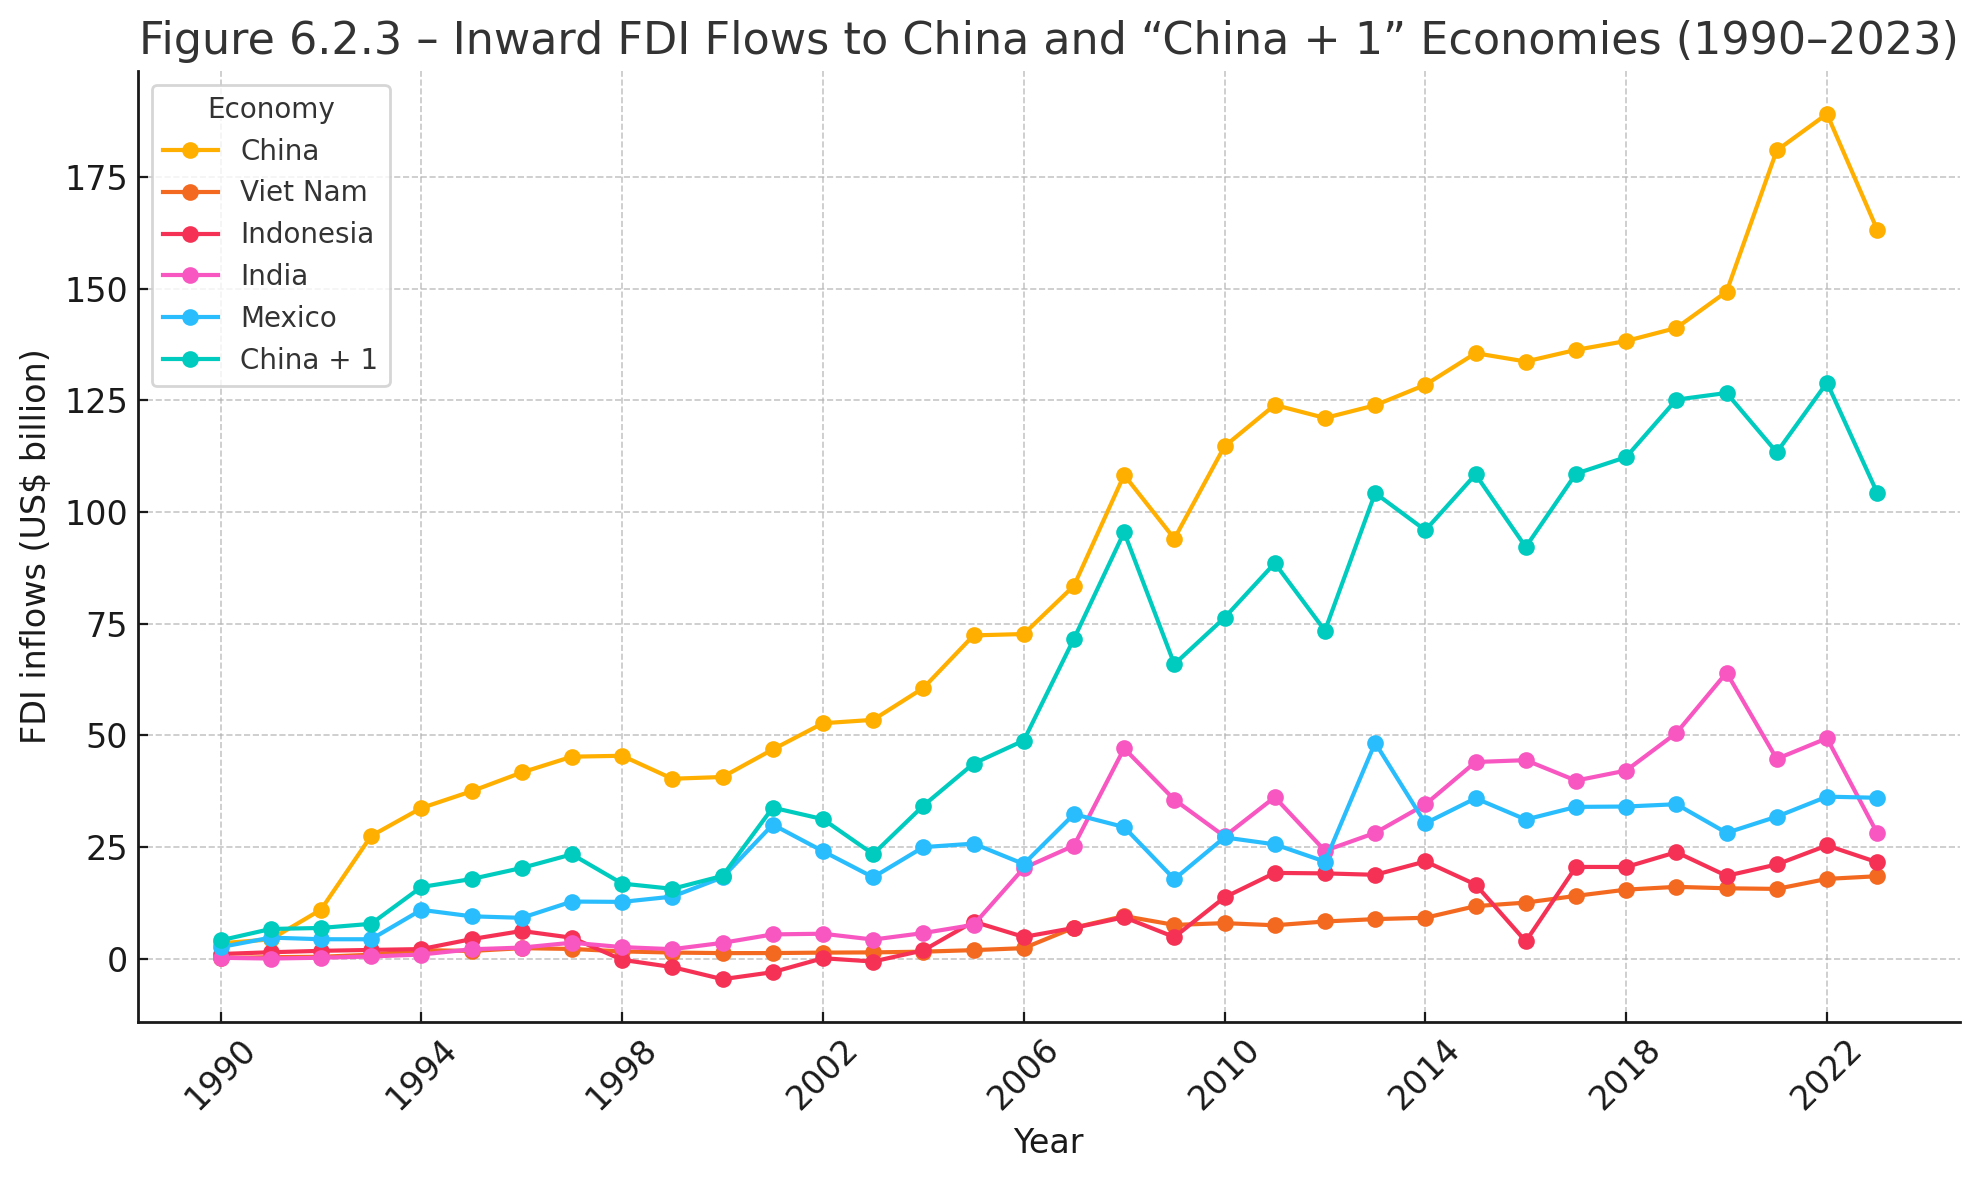

Figures 6.2.3 & 6.2.4 — Inward FDI: “China + 1” is additive, not a substitute
The long-run panel (6.2.3) shows that while Viet Nam, India, Indonesia and Mexico have all attracted more green-field capital since the mid-2010s, China’s own inflows continue to rise on a much higher base. The zoom-in (6.2.4) confirms the pattern for 2012-22: aggregate “China + 1” receipts edge closer to, but still trail, China’s intake—and nearly a third of that extra-regional total is Chinese multinationals funding satellite plants. Multinationals are hedging with secondary hubs, yet China remains the primary destination and the capital provider, reinforcing rather than replacing its central role in Asian supply chains.
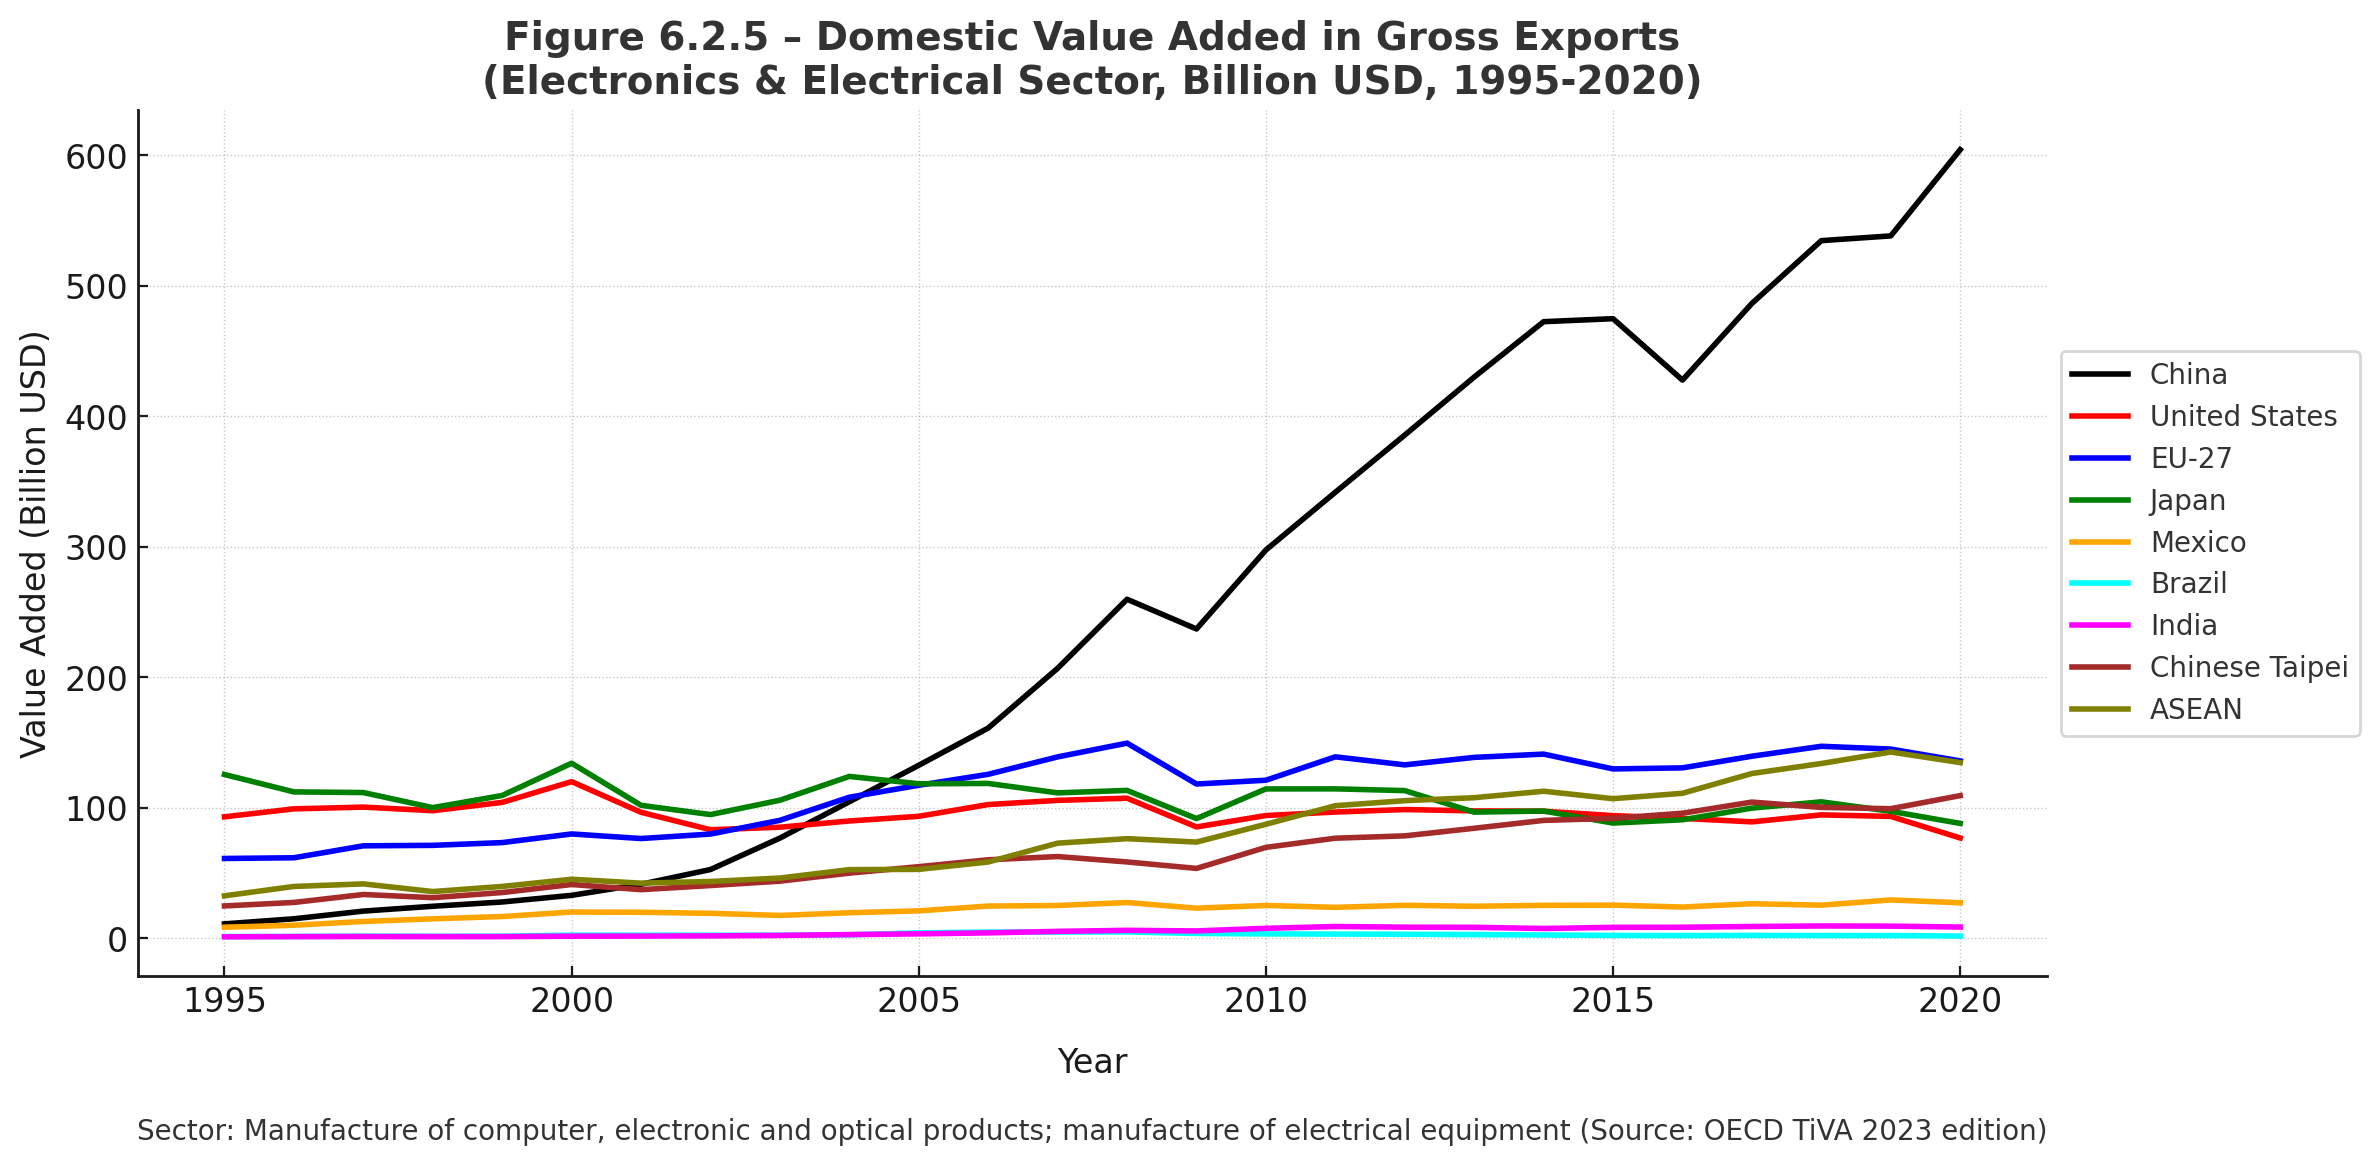

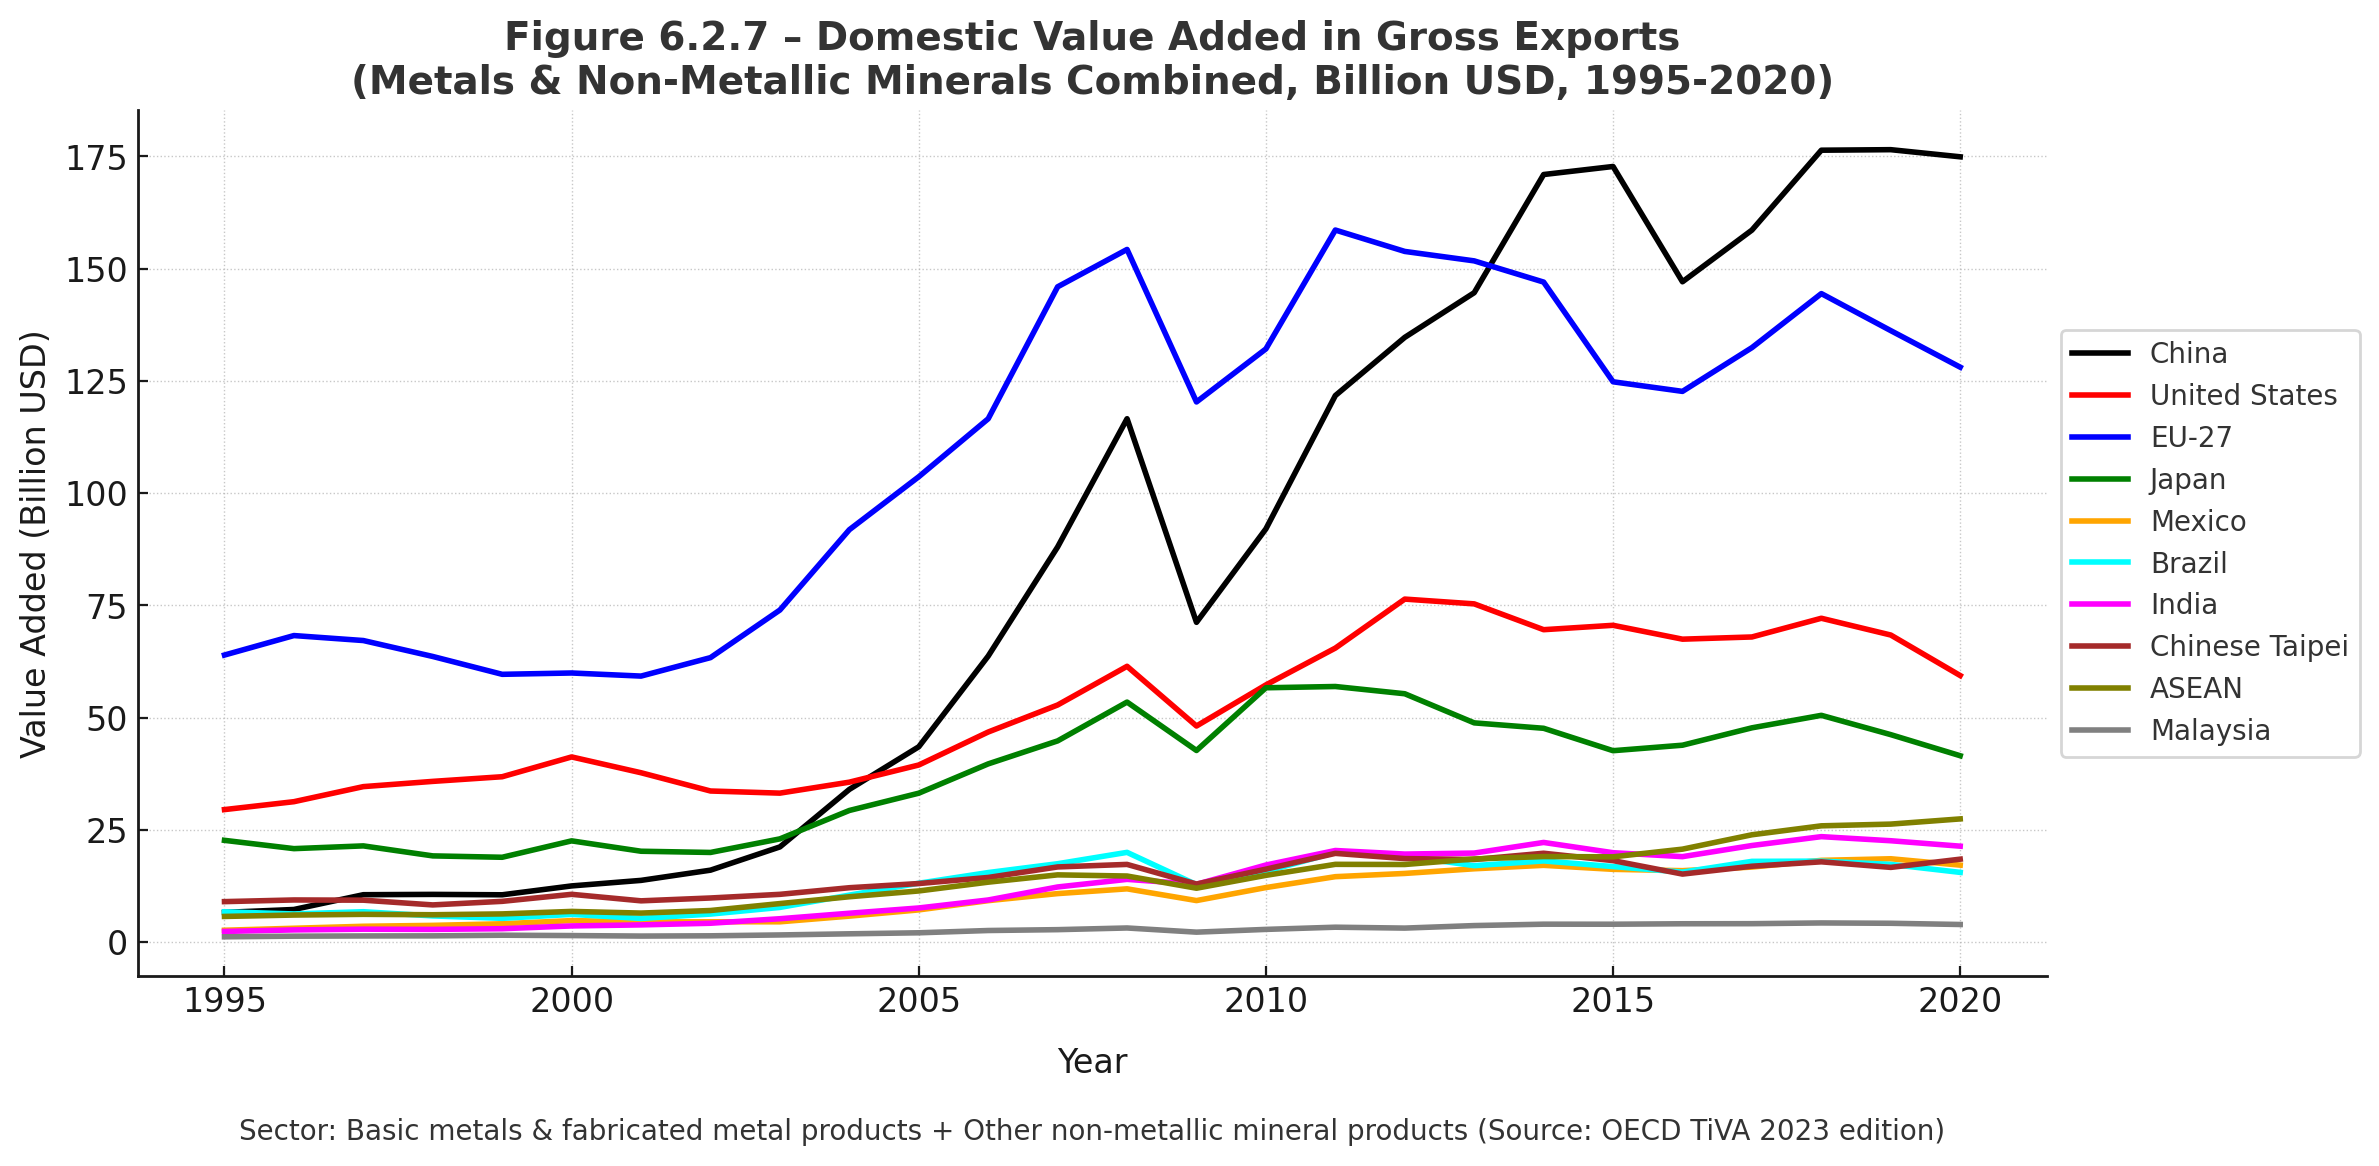

Figures 6.2.5 – 6.2.8 — China’s climb from assembler to value-creator, and why it hasn’t stalled
In every sector the arc is clear. Electronics DVA (6.2.5) has risen more than twenty-fold since 2000, surpassing all advanced-economy peers. Autos (6.2.6) show a similar sprint: by 2023 China was the world’s largest vehicle exporter and the dominant source of EV value added. In metals & critical minerals (6.2.7) China overtook the EU long before 2020 and has since pushed its global refining share above 70 %. Stacked bars in 6.2.8 reveal the mechanism—surging domestic, especially indirect VA, meaning China now designs and fabricates the components embedded in others’ exports, not just final goods. Post-2020 expansion in batteries, NEVs and critical-mineral processing only widens the lead, anchoring China’s centrality even as supply chains reroute.

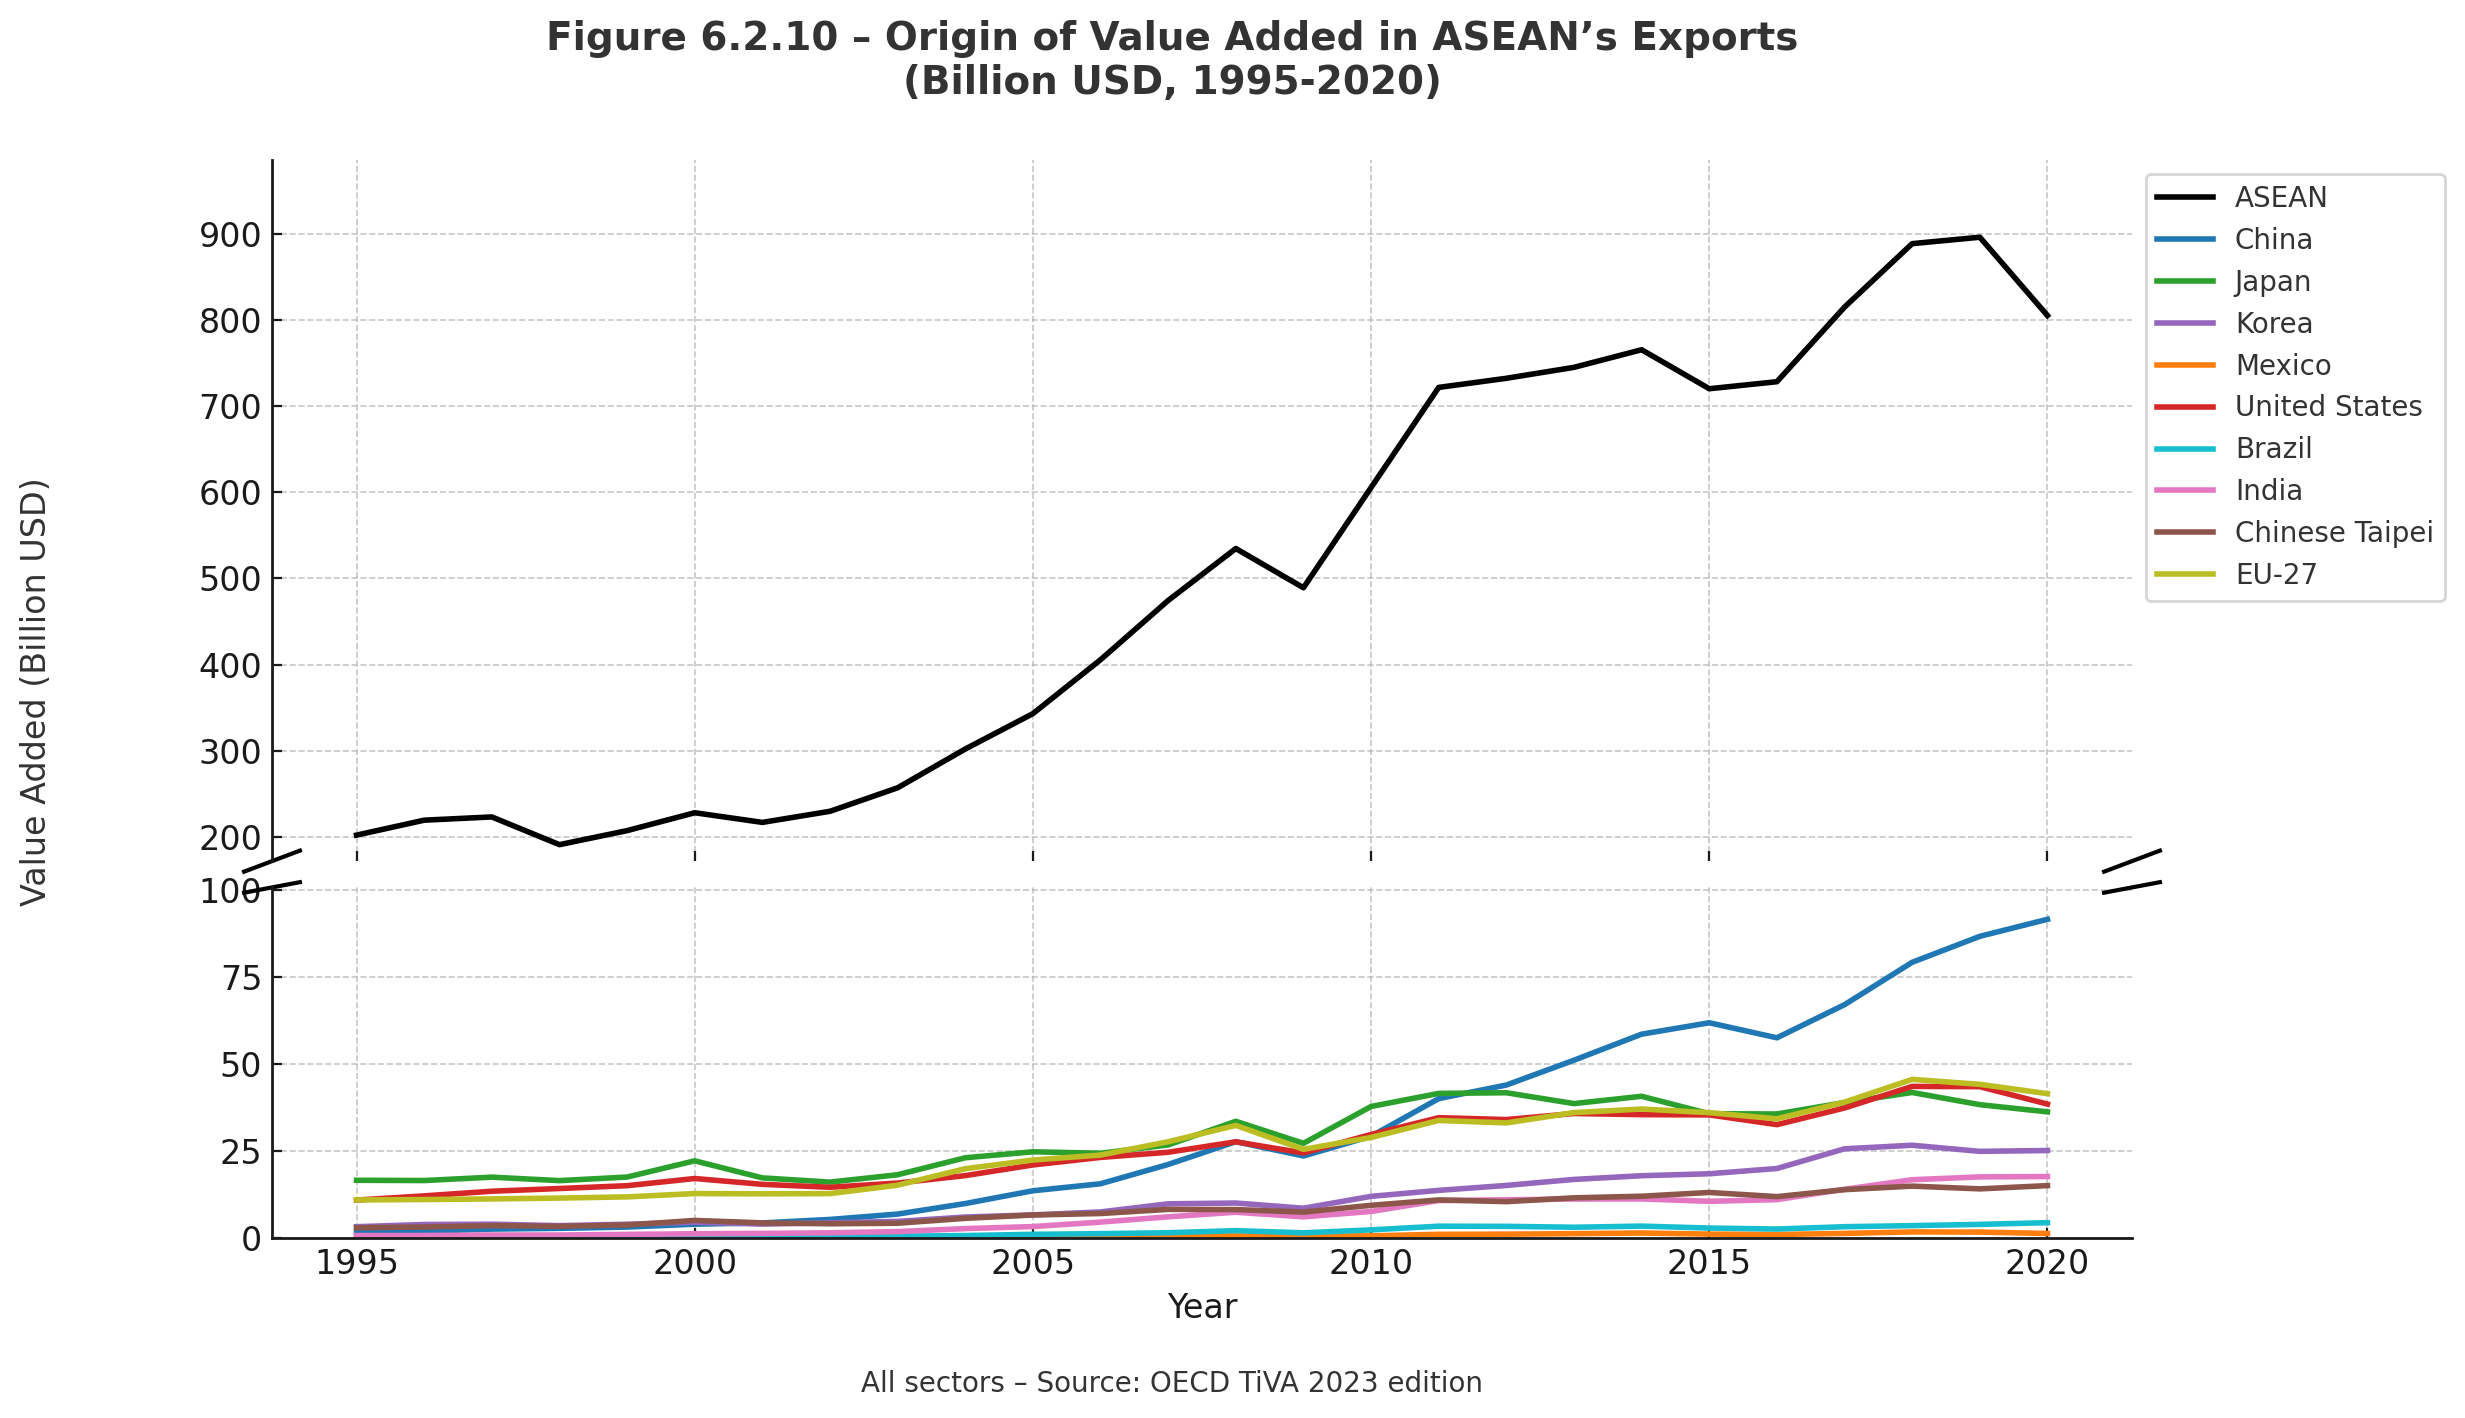

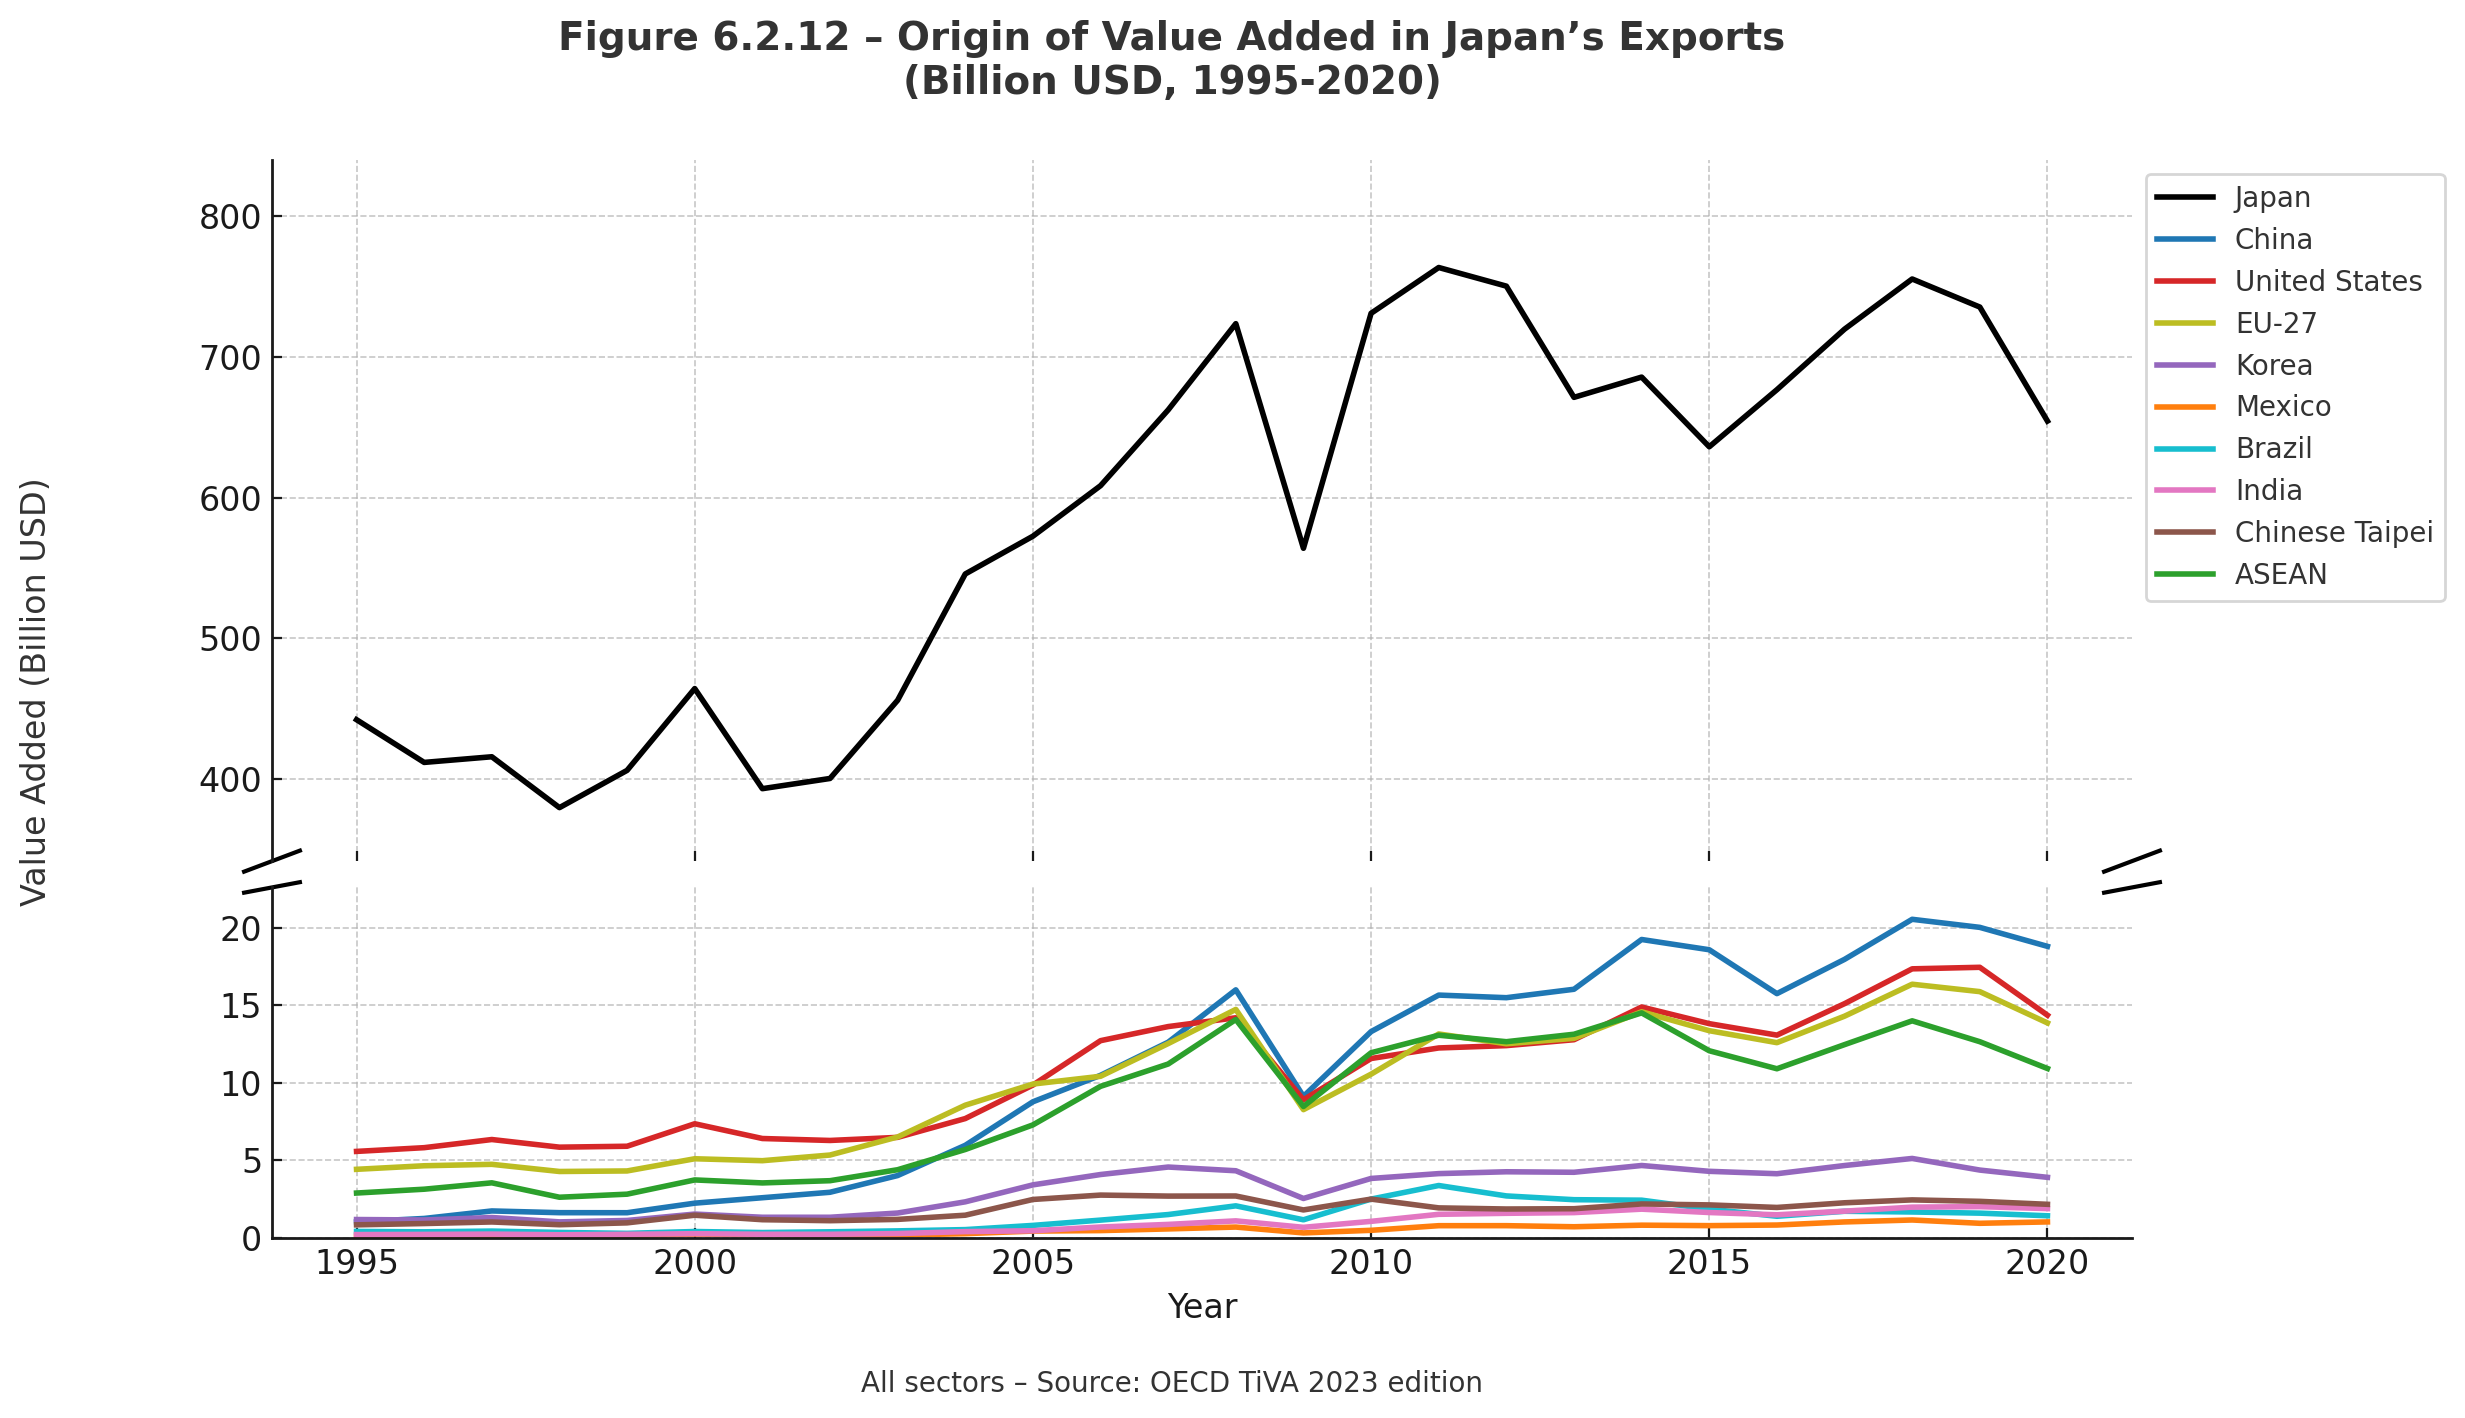


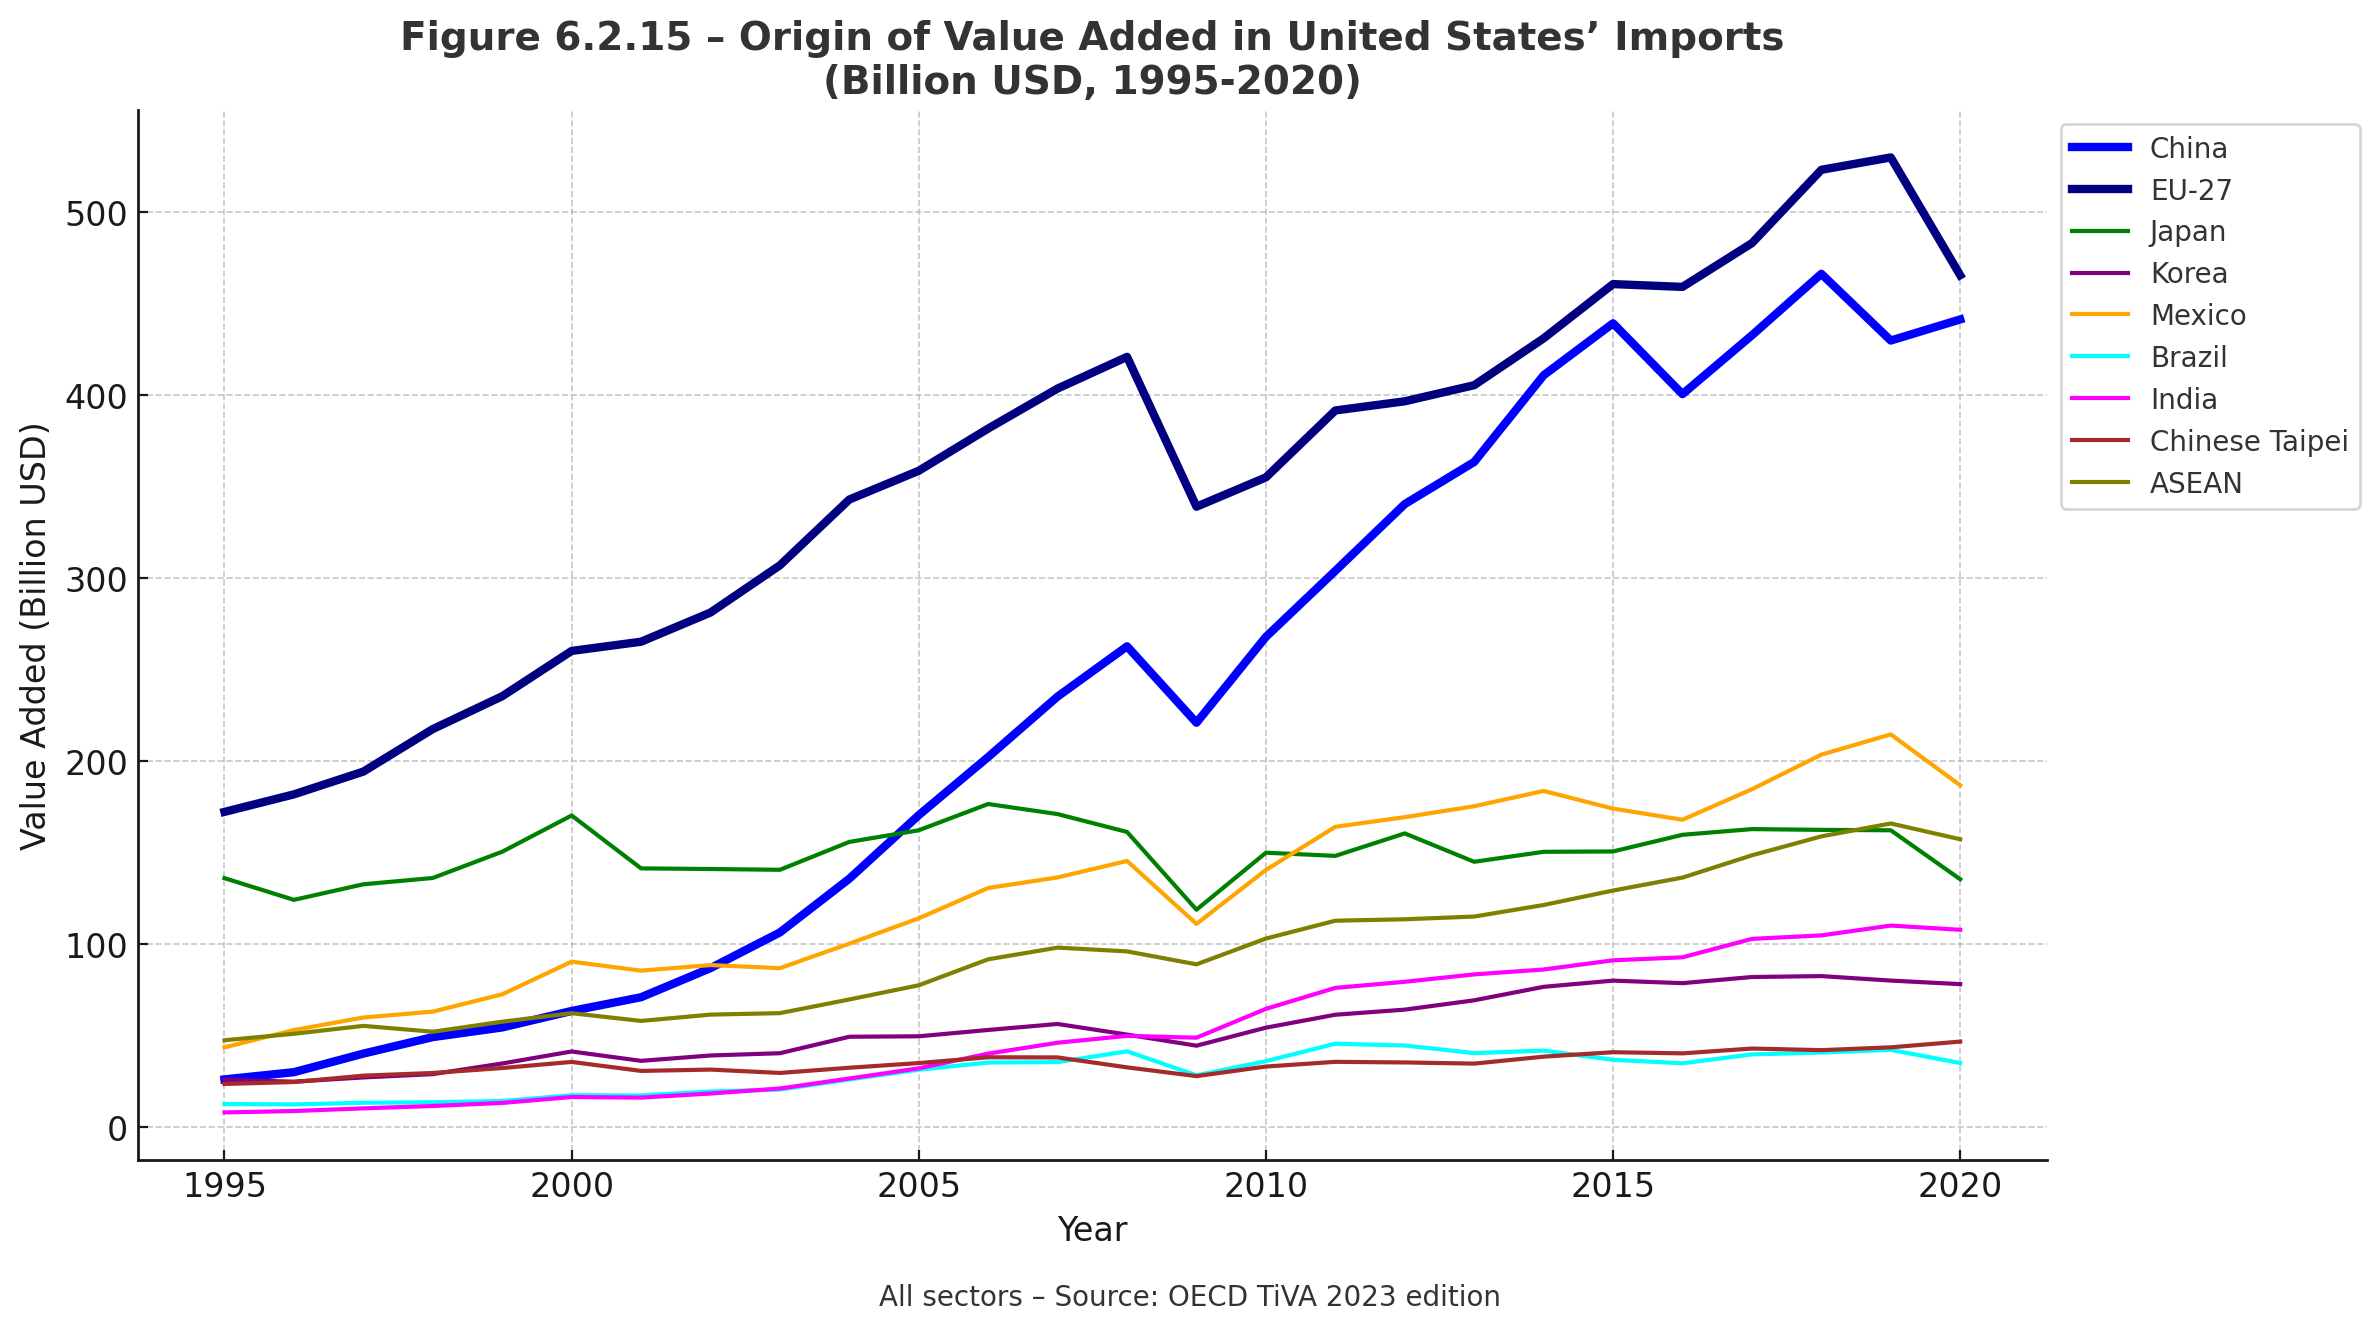
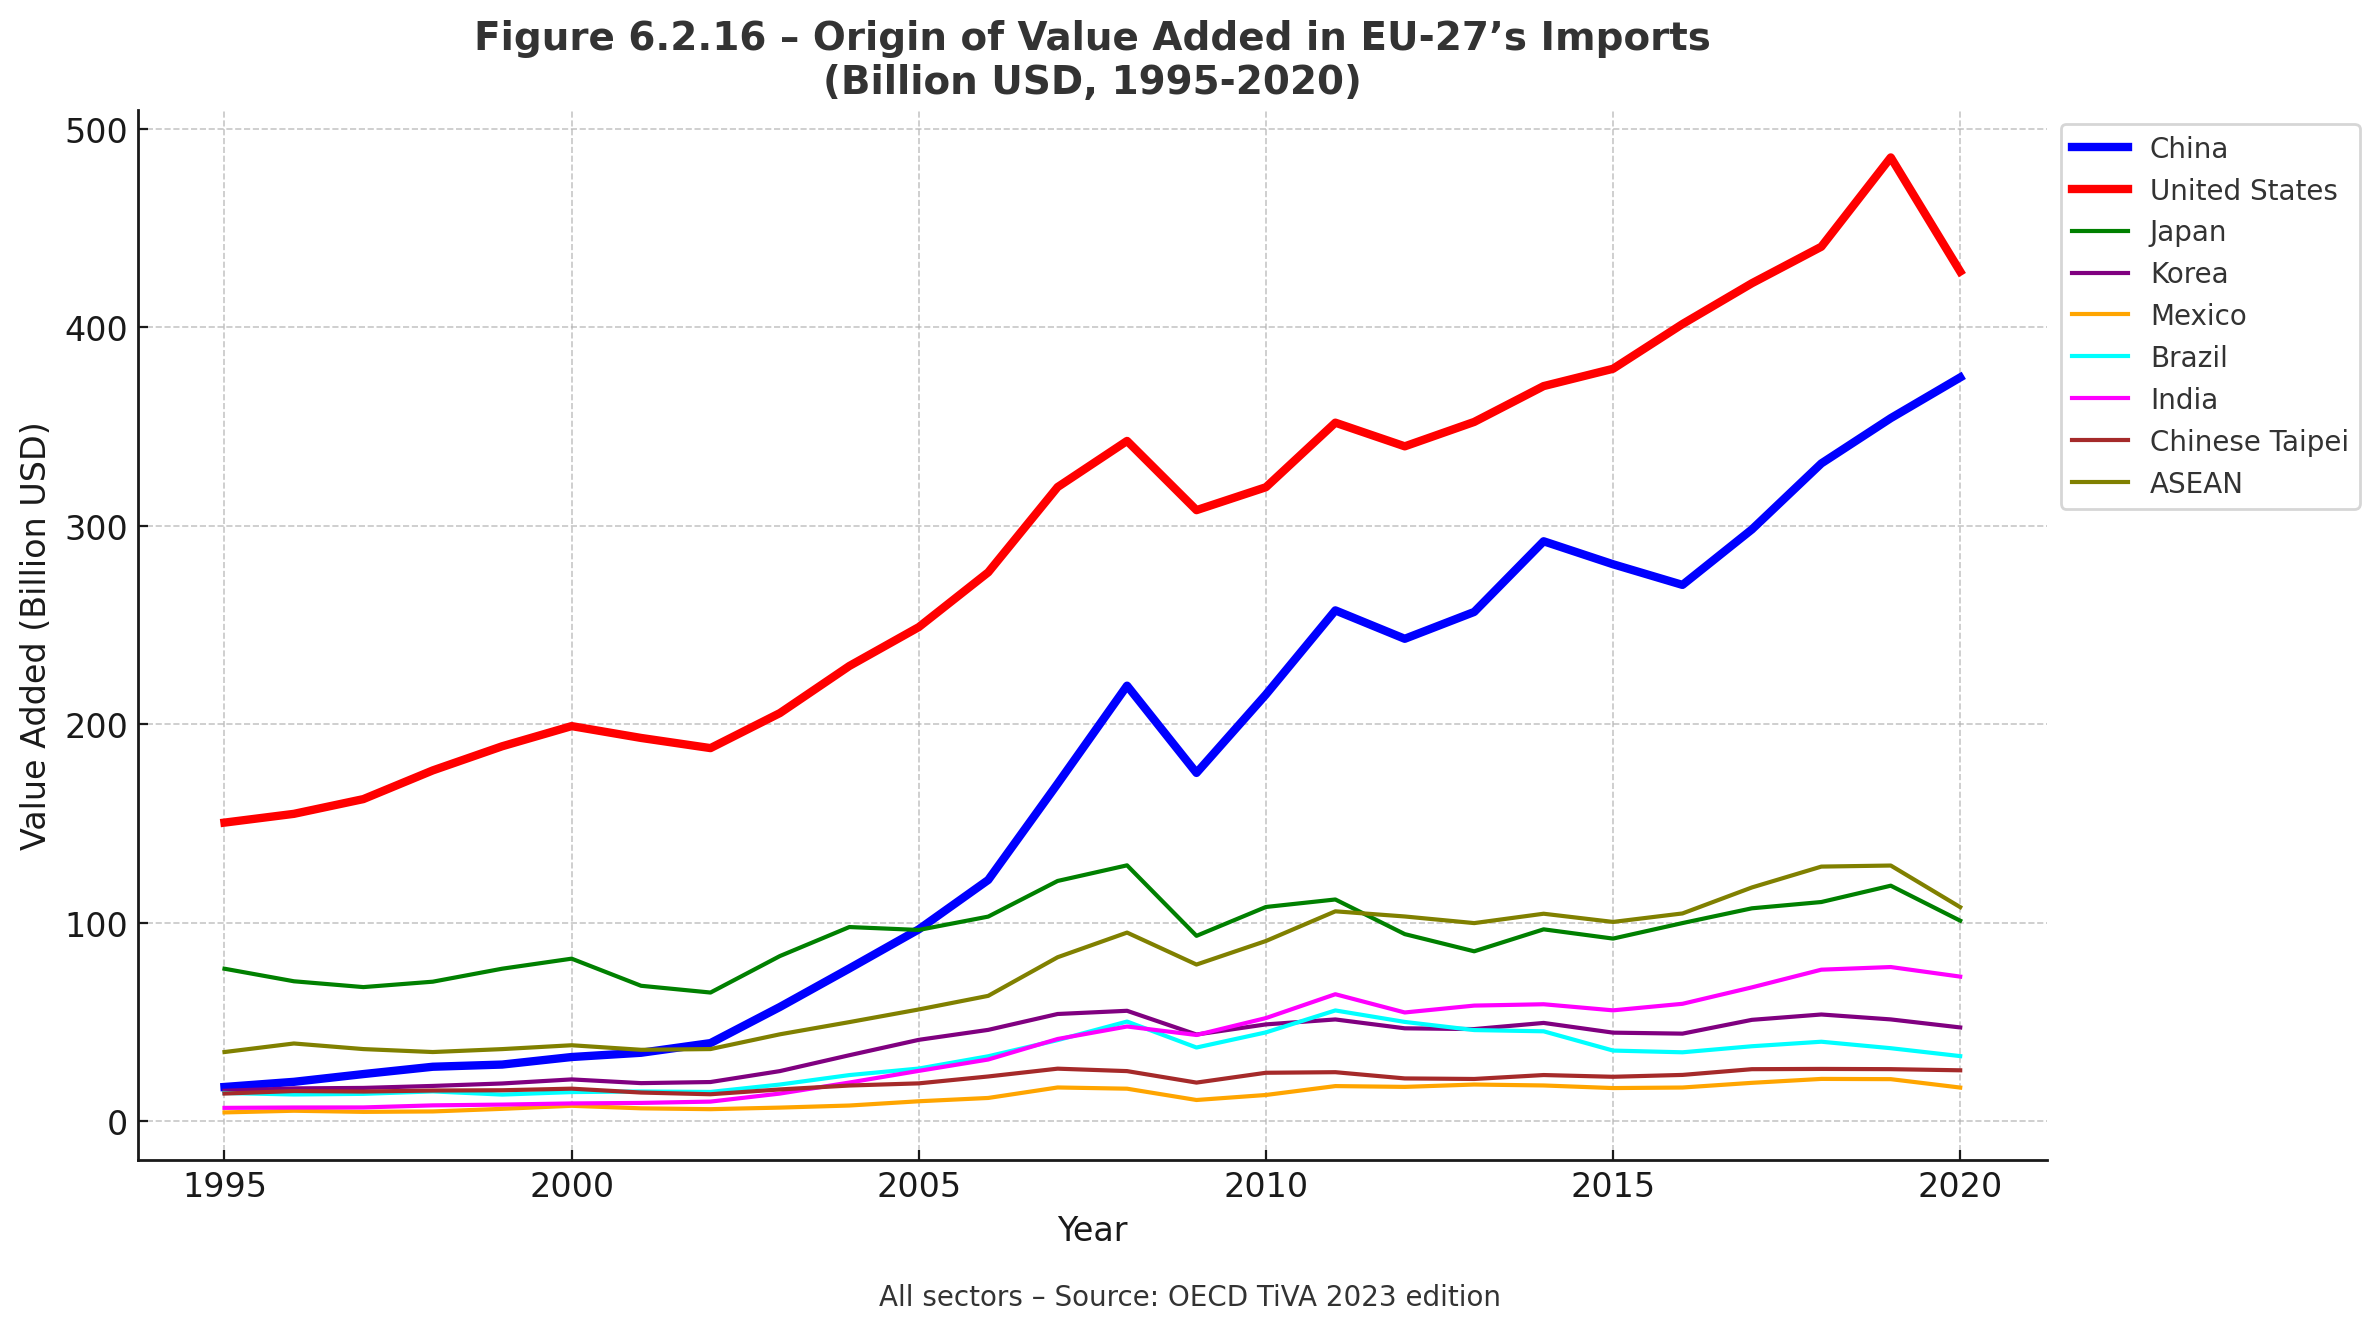
Figures 6.2.9 – 6.2.12
China’s export bundle still imports sizeable value-added from Japan, the EU-27 and the U.S., yet their share has slipped as China’s own and nearby (ASEAN, Korea, Chinese Taipei) inputs have grown (6.2.9). The mirror image appears downstream: ASEAN and Mexico now source rising foreign VA from China, while U.S.- and Japan-sourced content has plateaued (6.2.10 – 6.2.11). Japan’s exports (6.2.12) illustrate the loop—Chinese VA climbed from negligible in 1995 to the single-largest foreign slice by 2020—signalling deep two-way integration in electronics, autos and battery materials. Post-2020 data on EVs, batteries and critical minerals point the same way: manufacturing footprints are spreading, but upstream value capture is tilting further toward China-centred networks, not away from them.
4. Integrating Metrics into the Narrative
- Diversification, not Decoupling:
Although trade tensions and pandemic disruptions triggered relocation, China remains the critical node in regional supply chains, with intermediate inputs flowing through secondary hubs like ASEAN and Mexico. - Selective Investment and Integration:
FDI inflows continue to target high-value technology sectors in China, while outward Chinese investments bolster offshore production platforms in ASEAN economies—reinforcing regional economic interdependencies rather than diminishing them. - Technological Upgrading & Value-Chain Ascension:
China has advanced beyond low-cost assembly, significantly increasing domestic value-added content within its exports. Sectoral evidence demonstrates substantial progress in electronics, automotive, and strategic minerals, securing China’s centrality in higher-value segments of GVCs. - Persistent Western Dependence on Chinese Inputs:
Advanced economies, particularly the US and EU, have found it challenging to extricate themselves from Chinese intermediate products, indicating that “derisking” remains complex, costly, and incomplete.
5. Conclusion & Policy Implications
- Reconfiguration without Decoupling: China’s centrality persists, albeit with increased complexity and geographic diversification in GVCs.
- Rising Complexity & Risk: Additional supply-chain nodes and cross-border movements amplify geopolitical, tariff, and compliance risks.
- Strategic Interdependence: Efforts by Western economies to onshore advanced manufacturing coexist paradoxically with deepened Chinese upstream control over critical components and materials.
- Comprehensive Assessment Required: Evaluating manufacturing capacities without analyzing shifting GVC dynamics risks incomplete policy conclusions, as supply excesses relocate rather than vanish.
Note: All TiVA data are location-based; therefore, further refinement using ownership-based analyses could enhance future interpretations, though current findings remain robust in highlighting China’s critical geographic and functional role in global supply networks.
Finally, China’s internal economic model and its external interactions are intrinsically linked to its deployment of a diverse array of geoeconomic tools designed to secure national interests and enhance its global standing. Geoeconomics, the use of economic instruments to achieve geopolitical objectives, has become a hallmark of Chinese statecraft. Key tools include:
- Control over Critical Supply Chains: China has established dominant, and in some cases near-monopolistic, positions in the mining, processing, and manufacturing of critical raw materials (e.g., rare earths, cobalt, lithium, graphite) and key green technologies (solar panels, batteries). This dominance, often built through strategic state investment and industrial policy, provides Beijing with significant leverage over global supply chains essential for the digital and green transitions. The potential for supply disruptions, whether overt or subtle, serves as a powerful instrument of influence.
- Strategic Infrastructure Investment (e.g., Belt and Road Initiative): The BRI, through which China finances and constructs major infrastructure projects across numerous countries, creates economic interdependencies, secures access to resources and markets for Chinese firms, and often fosters political alignment or goodwill from recipient nations. These projects can reshape trade routes and establish China as a central node in regional and global connectivity.
- Trade and Investment Policy as Leverage: China has demonstrated a willingness to use trade actions (e.g., targeted import restrictions, unofficial boycotts, regulatory hurdles for foreign firms) and investment decisions as tools of economic statecraft to reward partners or exert pressure on countries with which it has political disputes.
- Financial Influence: While still developing, efforts to promote the international use of the Renminbi (RMB), establish alternative financial institutions, and extend substantial development loans also contribute to China’s geoeconomic toolkit, aiming to diversify away from dollar-dependence and increase its say in global financial governance.
The capacity to wield these geoeconomic tools is often directly related to the strengths and characteristics of China’s domestic economic system, including its vast industrial base, substantial financial reserves, and the ability of the state to coordinate the actions of its commercial enterprises for strategic ends. This proactive use of economic power to shape the external environment and secure strategic advantages is a defining feature of China’s approach to international relations, reflecting a clear understanding that economic might is foundational to geopolitical influence.
In essence, the internal structural imbalances of the Chinese economy are not merely domestic policy concerns; they are powerful engines driving China’s external economic behavior. The imperative to find outlets for industrial overcapacity, the strategic drive to secure resources and move up global value chains, and the ambition to translate economic scale into geopolitical influence all contribute to a complex and often contentious interaction with the global system. These global ripples, in turn, generate responses from other international actors, creating the feedback loops that will be examined in the subsequent chapter.
7. The Feedback Loop: External Pressures, Internal Dilemmas, and the Geopoliticization of Rebalancing
How does external pushback (trade wars, tech controls, de-risking) intensify the pressure on China to fix its internal model, yet simultaneously encounter domestic resistance to reform?
The global ripples emanating from China’s internal economic imbalances and its assertive geoeconomic strategies, as detailed in Chapter 6, have not gone unanswered. The reactions from other major economies—particularly the United States and its allies—in the form of trade disputes, technology controls, and strategic “de-risking” initiatives, have created a powerful and complex feedback loop. This external pushback significantly reshapes Beijing’s policy calculus. On one hand, it starkly underscores the vulnerabilities of China’s existing model and intensifies the objective economic and strategic urgency for accelerating internal rebalancing and fostering greater self-reliance. On the other hand, these same pressures can paradoxically strengthen domestic political forces resistant to the very market-oriented reforms needed for efficient rebalancing, prioritizing instead state control, national security, and ideological cohesion. This intricate interplay transforms the rebalancing challenge from a primarily domestic economic task into a deeply geoeconomic and geopolitical predicament, a tightrope walk where the pursuit of security can ironically undermine pathways to sustainable prosperity.
Undeniably, the escalating external pressures since the late 2010s have served as a stark catalyst, forcing a re-evaluation within China of its developmental vulnerabilities and reinforcing the strategic arguments for certain aspects of rebalancing:
- Highlighting Export Dependency and Market Risks: The US-China trade war, initiated in 2018 with extensive tariffs, directly exposed the economic risks of over-reliance on specific export markets, particularly the United States. While China sought to mitigate the impact through trade diversion and other measures, the conflict vividly demonstrated how crucial trade flows could be disrupted by geopolitical considerations. This experience lent considerable weight to strategic concepts like the “Dual Circulation Strategy,” which emphasizes bolstering the domestic market (“internal circulation”) as a more reliable and resilient anchor for economic demand, reducing vulnerability to external volatility.
- Exposing Technological Chokepoints and Fueling Self-Reliance: The imposition of increasingly stringent US export controls on advanced semiconductors, chip-making equipment, and other critical technologies—targeting key Chinese firms like Huawei—laid bare China’s significant dependence on foreign inputs for its high-tech ambitions. This external “technological strangulation” provided a powerful impetus for Beijing’s accelerated drive towards “technological self-reliance” (科技自立自强). Achieving indigenous innovation in core components and foundational technologies transitioned from a long-term developmental goal to an immediate national security imperative, justifying massive state-led investment in domestic R&D and supply chain localization.
- Validating Concerns about Supply Chain Vulnerability (“De-Risking”): The broader international discourse around “de-risking” supply chains—aimed at reducing dependence on any single country, particularly China, for critical goods and technologies—signaled a potential long-term structural shift in global investment and sourcing patterns. For Beijing, this narrative reinforces the perceived need to cultivate robust domestic sources of growth, innovation, and supply, anticipating a less benign and more fragmented global economic environment where access to foreign markets and advanced technology may become increasingly conditional or contested.
However, the paradox of this feedback loop is that these very external pressures, while highlighting the need for change, can concurrently strengthen domestic political and ideological forces that resist certain types of deep, market-oriented structural reforms. This resistance often emerges from:
- Heightened Nationalism and Reduced Policy Flexibility: External criticism and actions perceived as hostile containment efforts tend to fuel nationalist sentiment within China, a sentiment often amplified by state media narratives. This can create a political atmosphere where policies involving compromise with foreign partners or significant market liberalization (which might be framed as concessions to external demands or as weakening state control) become politically difficult to pursue. A leadership perceived as yielding to foreign pressure risks domestic legitimacy challenges.
- Prioritization of National Security and State Control: In an environment characterized by intense geopolitical rivalry and perceived external threats, the policy emphasis naturally shifts towards bolstering national security, ensuring social stability, and strengthening state control over strategic assets, critical infrastructure, and data. This empowers factions within the Party-state apparatus that advocate for greater state intervention, SOE dominance in key sectors, tighter capital controls, and more stringent data governance. Such priorities can run counter to market-oriented reforms aimed at improving economic efficiency, leveling the playing field for private firms, or further liberalizing financial markets. The drive for technological self-reliance, while strategically understandable, might also lead to state-directed resource allocation that prioritizes national champions or “whole-of-nation” projects over more organic, market-driven innovation, potentially leading to inefficiencies.
- Fostering a “Siege Mentality” and Discouraging Openness: Persistent and broad-based external pressure can cultivate a “siege mentality,” where the overriding imperative becomes national resilience and stability at almost any cost. This can lead to a preference for maintaining existing economic and social structures, even if they are inefficient (e.g., supporting certain SOEs to ensure employment), over pursuing potentially disruptive reforms that might improve long-term efficiency but could cause short-term instability. It may also inadvertently discourage the types of international openness—such as unrestricted academic collaboration, free flow of information, or deep integration of foreign firms in sensitive sectors—that have historically been crucial catalysts for innovation and productivity growth.
Box 7.1: External Pressures in One Glance
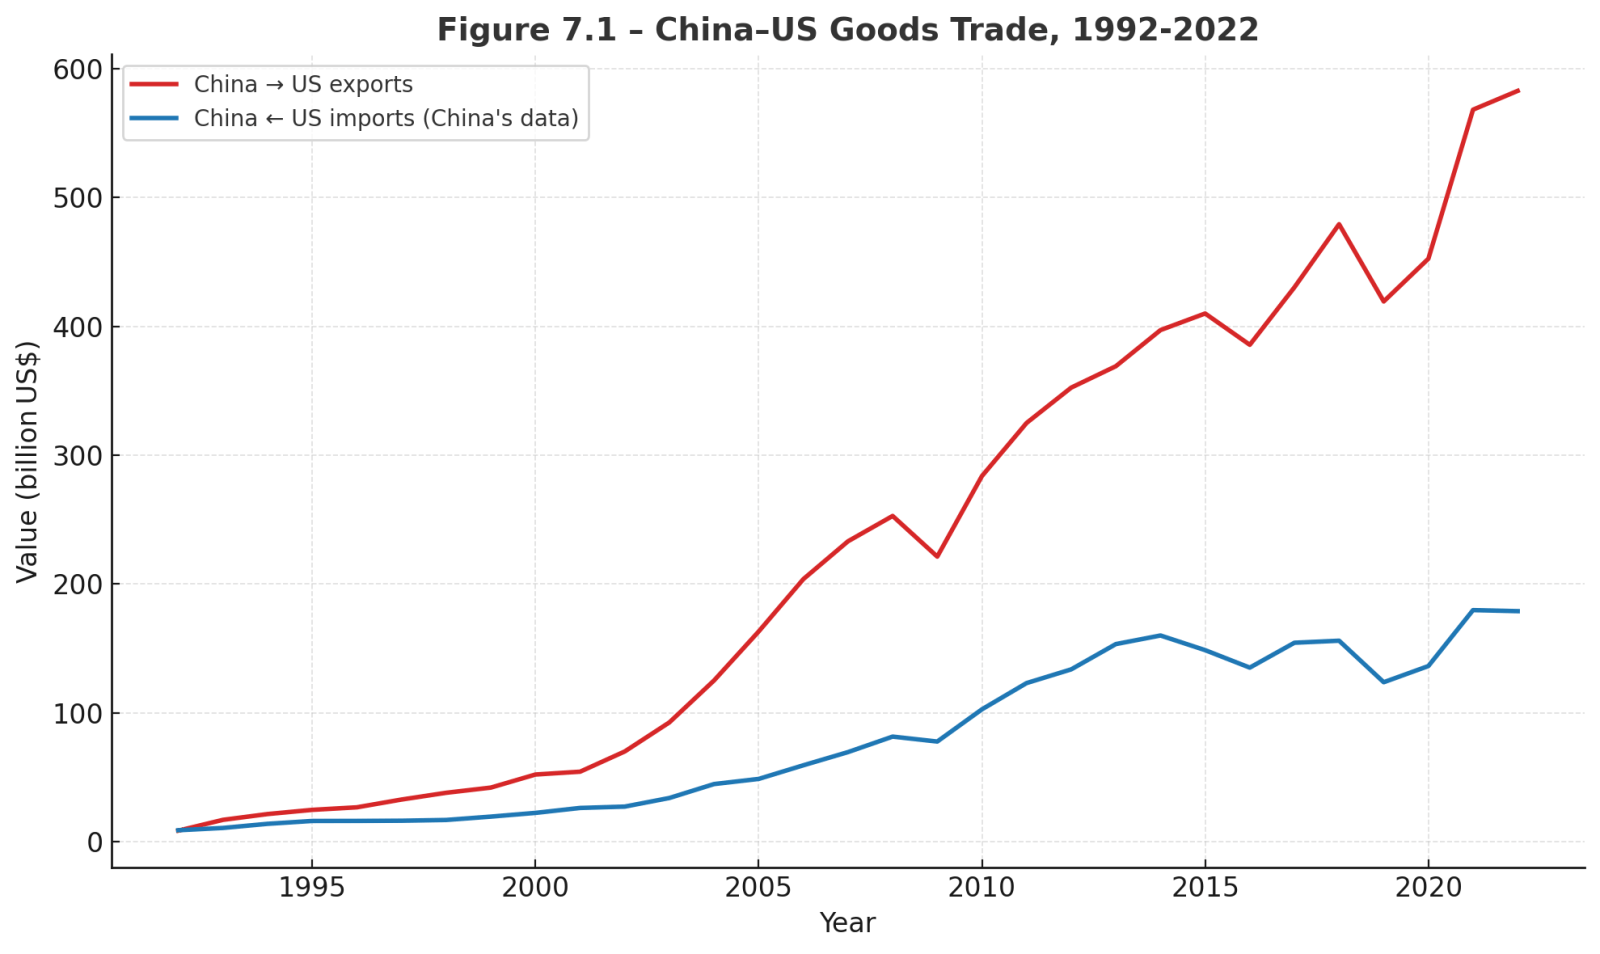
Source: WITS.
What the figure shows : China’s exports to the United States flattened and briefly dipped in 2019‑20—the tariff shock—before rebounding in 2021‑22. Imports from the US display a shallower pattern. The absence of a dramatic, lasting break highlights how global value‑chain re‑routing, exchange‑rate moves, and strong US demand have so far cushioned headline trade flows.
Key Take‑aways
| Pressure point | Hard fact (latest public data) | Why it matters for rebalancing |
|---|---|---|
| Tariffs & De‑risking | Average US duty on Chinese goods rose from ≈3 % (2017) to ≈51 % (May 2025).¹ | Tariffs prune specific product lines but broad demand substitution keeps the aggregate export line resilient, masking firm‑level stress. |
| Tech chokepoints | > 85 % of China’s EDA software still foreign‑supplied (ITIF 2024). | Dependencies drive costly “self‑reliance” campaigns, reallocating capital away from consumption‑raising uses. |
| Cost ripple | IMF simulations find a full China‑US decoupling could cost 5 pp of global GDP or income losses depending on estimations over a decade.² | Higher import costs squeeze real household income worldwide, including in China, slowing the consumption pivot. |
¹ Peterson Institute tariff tracker (May 2025).
² IMF WEO April 2024, ECB WPS 2839.
External frictions have not collapsed China–US trade, but they have exposed granular vulnerabilities (advanced chips, EDA, lithography) and forced costly duplication of supply chains. The result is a strategic push for domestic demand and tech self‑reliance—yet that same push diverts resources from household income growth, complicating the internal rebalancing Beijing needs most.
This dynamic creates profound internal policy dilemmas for China’s leadership. There is an inherent tension between the strategic necessity to respond to external pressures by enhancing domestic resilience (which often implies more state guidance and a focus on indigenous capabilities) and the economic logic that many of China’s structural imbalances (low consumption, inefficient investment) require deeper market-oriented reforms, greater transparency, and a more level playing field for all economic actors. The irony, is that a development path initially envisioned to build national strength through economic integration and a relatively peaceful rise has, due to its scale, speed, and specific characteristics, contributed to an international environment where security concerns now loom large, feeding back into and complicating the very economic model that produced them.
Navigating this feedback loop requires an extraordinary balancing act. Policies designed to bolster national security and technological self-sufficiency in response to external threats must be carefully calibrated to avoid stifling the domestic dynamism and market vitality needed for sustainable growth. Conversely, market reforms essential for rebalancing must be pursued in a way that is perceived domestically as strengthening, rather than weakening, national resilience and Party leadership. The choices made in managing this complex interplay—whether to prioritize the security-driven, state-led model or to embrace deeper, potentially politically challenging market reforms for economic efficiency—will fundamentally shape the nature and success of China’s rebalancing effort, its future growth trajectory, and its evolving role in the world. This sets the stage for the ultimate question explored in Chapter 8: What is the likely path China will tread on this rebalancing tightrope?
8. Charting China’s Next Decade: Future Trajectories, Enduring Dilemmas, and an Unwritten Balance-of-Power
Facing these intertwined internal and external pressures, what path is China likely on – genuine reform, managed stagnation, or a potential crisis – and what does this mean for its future power?
China’s economy now stands on a narrow beam, at the intersection of considerable internal challenges and extraordinary qualitative progress. Earlier chapters highlighted persistent structural tensions: a chronically low household consumption share, debt-heavy and state-led investments delivering diminishing returns, demographic and institutional constraints, and an increasingly complex and security-minded external environment. Yet, simultaneously, China has demonstrated a formidable capacity for technological upgrading, rapid innovation, and high-value integration within global value chains (GVCs).
The Party faces a delicate balancing act. It must decide how far it can pragmatically adjust its political-economic model to unleash market dynamism and consumption-led growth, while retaining strategic autonomy, state control, and societal stability. Three illustrative paths outline this intricate policy calculus.
Scenario A: Managed Stagnation (“Muddling Through”)
Under this scenario, incremental reforms coexist with sustained state direction. Growth settles around 2–4%, supported primarily by high investment levels (~40% of GDP). Strategic sectors remain under state oversight, debt levels are managed rather than resolved, and dual-circulation emphasizes technological self-sufficiency and security. While this path avoids acute crises, it perpetuates long-term inefficiencies and keeps China in a state of high debt and modest productivity gains.
Scenario B: Genuine Rebalance (“Difficult Transition”)
A more ambitious scenario involves bold structural reforms designed to significantly lift household incomes and broaden social safety nets, resulting in increased domestic consumption and improved resource allocation. Investment as a GDP share moderates, total factor productivity (TFP) rises notably, and debt accumulation stabilizes. The private sector gains clearer regulatory frameworks and operational confidence. Under this trajectory, China’s economy could stabilize at a sustainable growth level of around 4–5% before demographic constraints fully materialize. Though politically challenging, this scenario positions China as an even more influential global economic actor, offering both an expansive import market and formidable competitive innovation capabilities.
Scenario C: Shock & Retrenchment (“Crisis Response”)
Triggered by either a severe internal financial crisis (such as a property or LGFV collapse) or a geopolitical confrontation, this scenario would see growth stall or even contract sharply. Government response would likely involve extensive state intervention, capital controls, and heightened national security measures, severely limiting market dynamism and international engagement. While potentially stabilizing in the short term, this inward-looking path risks sustained economic stagnation, diminished global influence, and heightened internal pressures.
Most Likely Path: A Dynamic Equilibrium
In reality, China’s trajectory will likely be a fluid combination of these scenarios. Policymakers will pursue selective, incremental reform while leveraging strategic state intervention, aiming to minimize acute crises. However, each passing year without deeper structural change increases future adjustment costs and heightens underlying vulnerabilities.
Balancing Structural Constraints with Technological Dynamism
Critically, any balanced assessment of China’s future must recognize its impressive qualitative upgrading. Over recent decades, China has transitioned from low-cost assembly to advanced manufacturing, sophisticated R&D, and rapid innovation in critical technology fields such as electric vehicles, renewables, artificial intelligence, and digital infrastructure. Foreign firms continue to view China as a vital hub for high-end R&D and engineering, reflecting the considerable strengths and potential within the Chinese innovation ecosystem.
Indeed, the selective tightening of Western export controls—particularly around semiconductors and strategic technologies—is itself a testament to China’s rapid catch-up and innovation capabilities, highlighting fears of being surpassed in critical high-tech domains. This qualitative progression significantly offsets some structural impediments, offering a powerful counter-narrative to a purely pessimistic outlook.
Yet, even these remarkable technological advances cannot fully neutralize persistent domestic imbalances. Technological innovation must translate into broader economic and societal gains, addressing the critical income distribution puzzle and structural inefficiencies that currently limit household consumption and economic sustainability.
Key Insights and Implications
- Complex Interplay of Economics and Politics
Deep economic reforms required for sustainable rebalancing inevitably challenge vested interests and dilute direct state control, presenting significant political trade-offs. - Dual Circulation Strategy: Opportunities and Risks
China’s push toward technological self-reliance and stronger domestic demand holds significant potential, but state-led execution risks reinforcing existing inefficiencies. - Non-negotiable Demographic Pressures
The shrinking labor force and aging population mean China must achieve robust productivity growth simply to maintain current prosperity levels. - Geopolitical Feedback Loop
International pushback intensifies the security-driven agenda within China, complicating market-oriented reforms and potentially deepening internal imbalances. - Urgency of Structural Adjustment
Each year without comprehensive reform magnifies future costs, narrowing the window for an orderly transition.
China’s economic future remains profoundly open-ended. While structural imbalances undeniably constrain China’s trajectory, its proven capacity for rapid innovation, industrial upgrading, and integration into high-value segments of global supply chains provides a compelling counterbalance. This complexity demands humility and caution in forecasting China’s precise path forward. Ultimately, the choices made by Chinese policymakers—balancing economic pragmatism with political control, innovation-driven growth with market openness, and domestic resilience with international integration—will decisively shape China’s trajectory and profoundly influence the global economic and geopolitical order through the 2030s and beyond, charting a path whose trajectory is critical not just for China, but for the world.
