

1. Introduction
Steel lies at the core of modern infrastructure and economic development. Yet its production—currently around 1.8 to 2 billion tonnes of crude steel per year—comes at a substantial environmental cost. According to the International Energy Agency (IEA), the steel industry accounts for roughly 7–8% of global carbon dioxide (CO₂) emissions, representing about 3 gigatonnes (GtCO₂) annually in absolute terms. This figure underscores the critical role steelmaking plays in both driving industrial growth and contributing to climate change.
As global demand for steel continues to rise, especially in emerging economies, the challenge of reconciling this demand with the need to drastically reduce emissions grows more urgent. Achieving internationally recognized climate targets—such as the Paris Agreement’s objective to limit global temperature rise well below 2 °C—will require deep and rapid decarbonization of the steel sector. Indeed, many national and corporate net-zero strategies now identify steel as a priority sector for emissions reductions.
This article offers a data-driven examination of steel’s evolving emissions profile, the technological and policy pathways to decarbonize, and the economic implications of transitioning to low-carbon steelmaking. We will explore near-term options, such as optimization of current processes and increased use of scrap-based electric arc furnaces, alongside medium- and long-term solutions, including hydrogen-based direct reduction and carbon capture, utilization, and storage (CCUS). Throughout, we consider variations in regional resource availability, local regulatory frameworks, and global market pressures.
Embracing the complexity of this transition means navigating multiple layers—from technical feasibility at the plant level (micro) to global steel trade and policy instruments (macro). By presenting real-world examples, key performance indicators, and life cycle metrics, the following chapters aim to clarify how the steel industry’s decarbonization can be both economically viable and central to broader climate goals. Crucially, this analysis recognizes the uncertainties in technology maturity, investment costs, and geopolitical context—underscoring that no single pathway will suit all regions equally.
2. Context and current state of the steel industry
2.1 Global production and regional distribution
Global crude steel production reached approximately 1,865 million metric tons (Mt) in 2020, reflecting steel’s pivotal role in infrastructure, manufacturing, and consumer goods (World Steel Association, 2021). Of this total, China alone accounted for around 57%—producing nearly 1,065 Mt in the same year (World Steel Association, 2021). Other leading producers include the European Union, India, Japan, the United States, and Russia, collectively shaping global market dynamics, trade flows, and technology diffusion.
At the macro level, such concentration of production has far-reaching effects on supply chains, investment priorities, and policy decisions. However, at the micro (plant) level, regional resource availability, local environmental regulations, and proximity to end-users also heavily influence the choice of technology and process configurations.
2.2 Main production routes
Modern steelmaking can be divided into three primary routes, each with distinct feedstocks, emissions intensities, and technological characteristics (IEA, 2020; World Steel Association, 2021):
- BF-BOF (Blast Furnace–Basic Oxygen Furnace)
- Still the most common route globally, contributing roughly 70% of total steel output (IEA, 2020).
- Uses coal-based coke to reduce iron ore in the blast furnace, followed by steel refining in a basic oxygen furnace.
- Prevalence reflects historical resource endowments (coal, iron ore) and integrated production models that benefit from economies of scale.
- EAF (Electric Arc Furnace, scrap-based)
- Accounts for around 24.5% of global steel production (BloombergNEF, 2022).
- Relies on recycled scrap steel and electricity; direct emissions can be significantly lower than BF-BOF, especially if the electricity supply is decarbonized (IEA, 2020).
- Thrives in regions with ample scrap availability and comparatively low electricity costs (e.g., the United States, parts of the EU, Turkey).
- DRI-EAF (Direct Reduced Iron feeding EAF)
- Represents about 5.5% of global output (IEA, 2020).
- Uses natural gas or hydrogen to reduce iron ore directly, then melts the resulting DRI in an EAF.
- An emerging route for deep decarbonization, provided low-carbon hydrogen and renewable electricity are available.
Table 1. Main production routes
| Route | Share of Global Steel | Approx. Volume (Mt) | Key Inputs |
|---|---|---|---|
| BF-BOF | ~70% | ~1,305 | Iron ore, coke, limestone |
| EAF (Scrap) | ~24.5% | ~457 | Scrap, electricity |
| DRI-EAF | ~5.5% | ~102 | Iron ore, natural gas/hydrogen, power |
Regional advantages have historically driven the dominance of specific routes. Coal- and iron-rich regions built BF-BOF clusters, while scrap-rich, electrified markets gravitated toward EAF technologies. However, climate imperatives are shifting investment priorities toward routes that can leverage renewable electricity and green hydrogen, offering potential long-term competitive advantages to regions well-endowed in those resources.
Figure 1. Traditional BF–BOF route

Note: This diagram outlines the major steps and material flows in a coal-based integrated steel plant. It highlights how iron ore, coke, and fluxes enter the blast furnace, producing hot metal that is further refined in the basic oxygen furnace (BOF). Typical energy consumption ranges around 20 GJ per tonne of steel, with direct CO₂ emissions near 1.8 tCO₂/t and an additional ~0.2 tCO₂/t from indirect sources (e.g., electricity), totaling about 2 tCO₂ per tonne of finished steel.
2.3 Emissions profile and decarbonization pathways
The steel sector remains one of the largest industrial contributors to global CO₂ emissions—estimated at 7–9% of anthropogenic CO₂, or roughly 3.0 GtCO₂ per year (IEA, 2020; IPCC, 2018). This heavy reliance on coal underlines the urgency of deploying low-carbon steelmaking solutions.
Looking to 2050, scenario analyses by the IEA (2020), Mission Possible Partnership (2021), and EUROFER (2021) forecast a significant shift away from coal-based BF-BOF, contingent on policy, cost, and technology developments. Key pathways include:
- Green hydrogen-based DRI
- Carbon capture, utilization, and storage (CCUS) retrofits for BF-BOF
- Increased use of EAF (Scrap) in tandem with decarbonized electricity grids
Collectively, these routes could account for over 25% of global production by mid-century, assuming declining costs of renewables, scaling of hydrogen infrastructure, and supportive policy measures.
Figure 2. Hydrogen-based DRI–EAF route
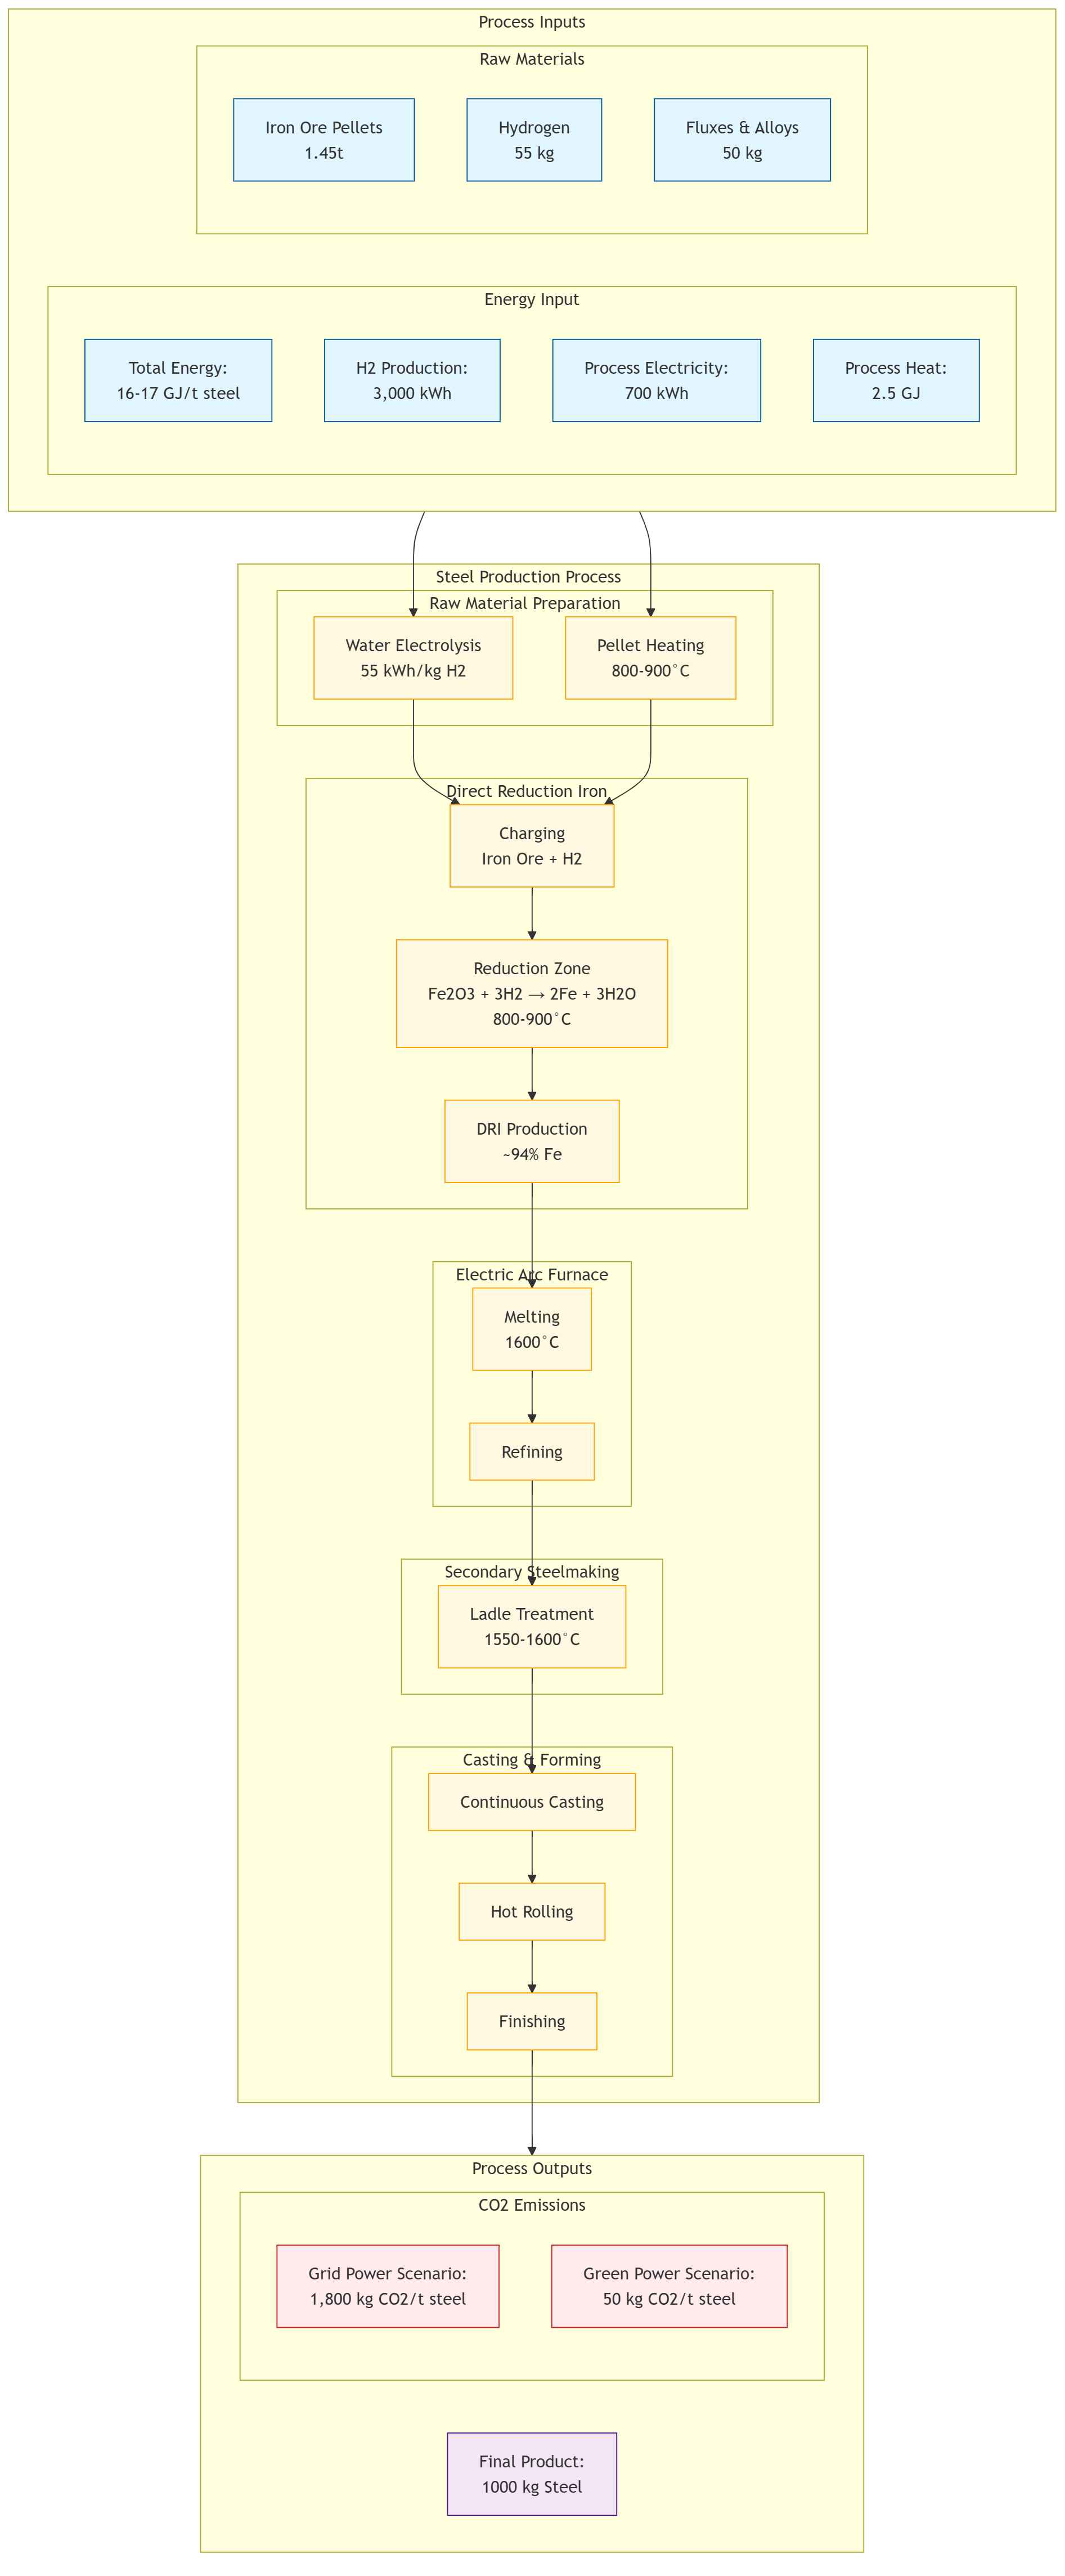
Note: This flowchart illustrates a low-carbon alternative wherein iron ore pellets are reduced by hydrogen (produced via water electrolysis), then melted in an electric arc furnace. Total energy requirements typically fall between 16 and 17 GJ per tonne of steel—dominated by hydrogen production and EAF electricity. Depending on the electricity source, emissions can range from ~1.8 tCO₂/t (if grid power is carbon-intensive) down to as low as 50 kg CO₂/t under near-zero carbon energy scenarios, showcasing the route’s potential for deep decarbonization.
2.4 Market dynamics and long-term demand
Despite market fluctuations, demand for steel in emerging economies remains robust due to continued urbanization and infrastructure expansion (World Steel Association, 2022). While demand in mature economies may stabilize or decline, the global outlook points to sustained if not growing steel consumption in the mid-term. In the longer term, improvements in material efficiency, extended product lifetimes, and enhanced recycling could moderate virgin steel demand (Material Economics, 2019).
From a micro perspective, steelmakers face decisions on capital investment cycles that can span decades, meaning near-term policy signals (e.g., carbon pricing, subsidies for clean energy) are pivotal. At the macro level, shifts in trade patterns—driven by carbon border measures (European Commission, 2021), hydrogen availability (Hydrogen Council, 2021), and the geographical distribution of high-grade iron ore—are set to redefine global comparative advantages.
2.5 Supply-demand imbalances and trade implications
Understanding steel’s role in both producing and consuming regions is key to mapping future market trajectories. China’s dominance stems from not only high production volumes but also vast domestic demand across construction, automotive, and manufacturing sectors (World Steel Association, 2021). Regions like the EU or the United States, however, may produce less than historical peaks while maintaining significant consumption, often importing semi-finished or finished steel to bridge gaps (OECD, 2020).
If carbon-adjusted trade policies (e.g., the EU’s Carbon Border Adjustment Mechanism) gain traction, regions with higher-emissions steel production could face increased costs in export markets. Conversely, producers with low-carbon capacity—and access to cheap, clean energy—could capture a competitive edge. These evolving trade dynamics make steel decarbonization as much a geopolitical and economic question as a technical one.
Figure 3: Global steel supply and demand

Such comparisons highlight structural surpluses and deficits, which are poised to change as decarbonization incentives reshape capital investment flows. Regions that import a significant share of their steel may see rising costs unless they develop local low-carbon production or negotiate favorable trade conditions. Conversely, net exporting regions could strengthen their position by transitioning early to cleaner technologies, capitalizing on a growing market for low-carbon steel.
3. Technological pathways for decarbonization
The steel industry’s journey toward deep decarbonization involves a range of emerging technologies that differ in maturity, cost structure, emissions reduction potential, and infrastructural requirements (IEA, 2020; Mission Possible Partnership, 2021). While traditional blast furnace–basic oxygen furnace (BF-BOF) production relies heavily on coal, alternative pathways—such as hydrogen-based direct reduced iron (DRI), carbon capture, utilization, and storage (CCUS), electrification with scrap-based electric arc furnaces (EAF), and bio-based feedstocks—are gaining traction. Their competitiveness depends on complex interactions among energy prices, raw material availability, policy incentives, and the feasibility of integrating novel processes into existing value chains.
3.1 Hydrogen-based Direct Reduced Iron (DRI)
Hydrogen-based DRI-EAF steelmaking substitutes fossil fuels (e.g., natural gas) with green hydrogen produced from renewable electricity. Pilot projects, including HYBRIT in Sweden and SALCOS in Germany, have demonstrated that using hydrogen can cut direct CO₂ emissions by more than 90% (HYBRIT, 2021; SALCOS, 2022; IEA, 2021). However, initial estimates suggest a 20–40% cost premium relative to conventional BF-BOF under current conditions (BNEF, 2022; Hydrogen Council, 2021). These premiums hinge on hydrogen costs (2–6 USD/kg), low renewable power prices (below 30 USD/MWh), and the capital requirements for EAF retrofits.
In the short term, hydrogen DRI adoption may remain localized to regions with abundant low-cost renewables and strong policy support, such as direct subsidies or long-term power purchase agreements. Over the medium to long term, scaling electrolyzer capacity and building hydrogen transport and storage infrastructure could drive hydrogen costs down, potentially nearing cost parity with coal-based routes by the early 2030s in favorable markets (IEA, 2021). If realized at scale, hydrogen-based steelmaking could fundamentally alter traditional supply chain dynamics by favoring regions with rich renewable resource endowments.
3.2 Carbon Capture, Utilization, and Storage (CCUS)
Retrofitting CCUS to BF-BOF plants presents a transitional strategy that captures a substantial fraction of process CO₂. Although reported capture costs of 50–100 USD/tCO₂ may appear manageable, site-specific factors—such as transport and storage infrastructure, energy penalties, and capital-intensive retrofits—can raise real-world cost premiums to 50–70% above conventional steel (Global CCS Institute, 2021; European Commission, 2021b; Wood Mackenzie, 2022). Success hinges on the availability of suitable CO₂ storage sites, stable regulatory frameworks, and large-scale pipeline or shipping solutions for captured carbon.
In the short to mid term, CCUS may offer a pragmatic option for regions heavily invested in existing BF-BOF facilities, as it allows incremental emissions reductions without fully replacing installed assets. Over the long term, however, widespread CCUS adoption depends on securing public acceptance, ensuring long-term liability for storage sites, and maintaining competitive costs relative to alternative low-carbon pathways.
3.3 Electrification with scrap-based EAF and renewable power
Scrap-based EAF steelmaking is already the most commercially mature low-carbon route. In many advanced economies, EAFs supply 30–40% of local production, offering up to 80–95% lower direct emissions than BF-BOF if coupled with decarbonized grids (World Steel Association, 2021; IRENA, 2021). Current estimates place the cost premium at around 10–20%, assuming scrap is readily available and renewable electricity is priced at 20–50 USD/MWh (BNEF, 2022).
In the short term, regions with established recycling systems and decarbonized power can further expand EAF capacity. Over the medium to long term, however, demand growth in emerging economies may tighten global scrap supplies, raising scrap prices and narrowing EAF’s cost advantage. Strengthening circular-economy policies, improving collection infrastructure, and investing in advanced sorting technologies can help secure stable scrap flows and preserve EAF competitiveness.
3.4 Bio-based reduction and other emerging alternatives
Bio-based processes that use sustainably sourced biomass instead of coal are at early pilot stages, with limited commercial deployment (Chatham House, 2020; IEA, 2021). Under optimal conditions—such as low-cost residual biomass and reliable supply chains—bio-based routes may show around a 40% cost premium compared to BF-BOF. However, uncertainties around feedstock availability, land-use impacts, and conversion efficiencies make these estimates highly variable, limiting near-term applicability to specific locales with ample bio-resources.
Beyond bio-based options, next-generation solutions, such as direct electrolysis of iron ore or advanced smelting reduction processes, could reshape the competitive landscape if they attain commercial maturity and achieve significant cost reductions. While these technologies remain speculative today, monitoring their research and development is critical, particularly in the mid to long term, as breakthroughs could rapidly alter regional competitive advantages.
3.5 Comparing technologies: cost, maturity, and barriers
A consistent methodology for comparing low-carbon steelmaking routes must account for feedstock procurement, energy infrastructure, capital expenditures, policy incentives, and lifecycle emissions. Hydrogen-based steel requires scalable electrolyzers and dependable renewable power; CCUS depends on full-chain CO₂ transport and storage; scrap-based EAFs rely on steady scrap supply and decarbonized grids; and bio-based pathways must ensure feedstock availability without undermining land-use sustainability. Table 2 summarizes current estimates of technology readiness, CO₂ mitigation potential, and cost premiums above conventional steel.
Table 2. Technology comparison
| Technology | Approx. TRL (2020) | CO₂ Reduction Potential | Cost Premium vs. Conventional | Key Barriers |
|---|---|---|---|---|
| H₂-based DRI-EAF | 6–7 (pilot scale) | Up to 90%+ | ~20–40% | Hydrogen availability, electrolyzer scaling, renewables |
| CCUS for BF-BOF | 5–6 (demo scale) | 60–90% | ~50–70% | Infrastructure, transport & storage liabilities, policy |
| Scrap-EAF + Renew. | 8–9 (commercial) | 80–95% | ~10–20% | Scrap supply/quality, stable renewable power |
| Bio-based Reduction | 4–5 (pilots) | 50–80% (if sustainable) | ~40% | Biomass availability, land-use impacts, process R&D |
These figures are indicative of current pilot and demonstration data. In practice, region-specific conditions—such as local resource endowments, regulatory environments, electricity and fuel pricing, and infrastructure readiness—will heavily influence which routes prevail. Frequent recalibration of cost and performance assumptions is essential, given the volatility of energy prices and the rapid evolution of clean energy technologies.
4. Constraints and uncertainties
Decarbonizing the steel industry is not just a question of deploying innovative technologies. Large-scale deployment of low- or zero-carbon steel also hinges on securing suitable raw materials, ensuring consistent access to affordable clean energy, and operating under clear, predictable policies and stable market conditions. Each factor introduces potential constraints and uncertainties that can significantly affect investment decisions, project timelines, and the overall feasibility of deep decarbonization.
4.1 Raw material challenges
Shifting from coal-based BF-BOF routes to lower-carbon methods increases the emphasis on raw material quality and reliability. High-grade iron ore pellets with low impurity levels are especially critical for hydrogen- or gas-based direct reduced iron (DRI). Several scenario analyses suggest that if hydrogen-based DRI-EAF pathways scale up rapidly, global demand for premium iron ore may surge by over 50–75% by the mid-2030s, tightening supplies and driving up prices. This intensification of competition could ultimately reshape international iron ore trade.
Scrap availability poses another major variable. Regions with well-established recycling systems—such as parts of Europe, North America, and East Asia—are already leveraging scrap-based EAF production to cut emissions and lessen their dependence on virgin iron ore. Yet, if overall steel demand outstrips secondary scrap flows, high-quality, low-residual scrap could experience sharp price increases, eroding EAF’s cost advantage. In such a scenario, other decarbonization routes (e.g., CCUS-equipped BF-BOF) might become more compelling.
Box 1: Iron Ore Quality as a Cornerstone for Low-Carbon Steel
1. Why Iron Ore Grade Matters
A move toward low-carbon steel—particularly hydrogen-based DRI-EAF routes—places iron ore grade front and center. High-grade ores (≥62–65% Fe content, low impurities) reduce energy consumption and emissions, while lower-grade sources require more energy to remove gangue and yield more slag. Even in BF-BOF operations, higher-grade inputs can trim coke and flux usage, though DRI-based processes are generally more sensitive to ore quality. As the steel sector seeks deeper decarbonization, large volumes of DR-grade (≥66% Fe) pellets or lump become critical for stable, efficient operations.
Snapshot of Ore Grades in Use
- BF-BOF: Often processes mid-grade (~58–62% Fe) plus sinter. Coke usage and sinter steps push emissions higher if ore is lower-grade or has many impurities.
- DRI-EAF: Typically needs ~65–67% Fe pellets or lump. Hydrogen-based DRI can be highly sensitive: even a 1% drop in Fe content may raise hydrogen consumption by 3–5%.
2. Micro-Level Impact on Energy and Cost
- Energy Consumption Changes
- BF-BOF: A 2–5% boost in coke or flux consumption for every 1–2% drop in Fe content below ~62%. This translates into extra fuel costs and CO₂ emissions.
- DRI-EAF: Hydrogen-based DRI can see a 3–8% jump in reductant/electricity use (including EAF) for each incremental decline in ore quality below ~66–67% Fe. If hydrogen is expensive, cost escalations are even sharper.
- Cost Competitiveness
- BF-BOF: Some estimates put a 2–5% cost increase per tonne hot metal for each 1–2% Fe drop.
- DRI-EAF: Could see a 2–4% cost uptick per 1% Fe drop. If H₂ is still in early-phase pricing (~3–6 USD/kg), the impact can be substantial.
- Industry Example – Vale’s Pellet Strategy
- Vale’s high-grade pellet feed (~65–67% Fe) from the Carajás region in Brazil helps DRI modules reduce energy usage by up to 10–15% compared to mid-grade lumps. Vale’s own data shows that a consistent supply of premium pellets can lower direct CO₂ emissions in DRI plants by over 5% (Vale, Investor Presentation, 2022).
3. Macro-Level Supply Chains and Current Trends
3.1 Global Output and Flows
- Global Iron Ore Production: ~2.5–2.6 billion tonnes in 2022 (USGS, Mineral Commodity Summaries, 2023), with Australia (36% global share) and Brazil (~20%) dominating seaborne exports.
- Key Exporters:
- Australia’s Pilbara region primarily outputs mid-grade (58–62% Fe), though new projects aim for 62–65%.
- Brazil’s Carajás region produces some of the world’s highest-grade (~65–67% Fe).
- Major Importers:
- China takes ~1.1–1.2 billion tonnes/year (~70% of global seaborne ore).
- EU, Japan, Korea together account for ~20%. The rest is spread globally.
3.2 Top-Down Decarbonization Objectives
- IEA Net Zero by 2050: Projects a major shift to hydrogen-based DRI and EAF, implying a surge in high-grade pellet demand (IEA, Net Zero by 2050, 2021).
- EU Fit for 55: Hints at a partial transition of ~20–30 Mt of DRI-based steel capacity by early 2030s, requiring consistent DR-grade ore (~66% Fe).
- China’s 2030/2060 Goals: Raises EAF share from ~15–20% to 30%+ by mid-century; if H₂-based DRI grows, high-grade pellet import needs increase significantly.
3.3 Bottom-Up Supply Expansions
- Australia: Pilbara majors (BHP, Rio Tinto, FMG) plan sustaining and incremental expansions of ~20–40 Mt over the next 5 years, mostly mid-grade. Premium lumps are less than ~15% of total shipments.
- Brazil: Vale aims to boost pellet feed output by ~20–30 Mt by 2030, with some portion specifically for DR-grade. S11D project expansions lead the way, but full capacity ramps can take 5+ years (Vale, 2022).
- Guinea’s Simandou: Potential 100 Mt/yr of ~65% Fe, though beset by infrastructure and political challenges, unlikely to see significant output before 2028–2030.
Comparing Supply vs. Demand:
Analysts project an additional 100–150 Mt of “premium” capacity by 2030. Meanwhile, top-down scenarios might require 200–300 Mt if H₂-based DRI ramps quickly, indicating a possible shortfall or price spike.
4. Bottlenecks, Brakes, and Levers
- Mining Infrastructure Lag
Greenfield projects (e.g., Simandou) or expansions in remote areas need new rail, port facilities, etc., which typically require 5–10 years. - Market Signals and Financing
Miners won’t commit to large high-grade expansions if they fear cyclical price drops or ambiguous policy signals. Long-term offtake contracts, carbon pricing, or robust “green steel” premiums could reduce risk. - Technological Flexibility
Some advanced DRI technologies might handle slightly lower-grade inputs. Alternatively, if scrap supply rises or CCUS retrofits remain viable, the urgent need for top-tier ores might be partially eased.
5. Conclusion: The Grade Equation in Steel Decarbonization
Iron ore grade increasingly shapes both micro-level energy costs and emissions, and macro-level supply chain feasibility. Ensuring stable access to high-grade ore (≥66% Fe) for hydrogen-based DRI can be a linchpin for achieving deep emissions cuts, but expansions require multi-year lead times, huge capital, and alignment with policy goals. While top-down scenarios foresee a swift shift toward H₂-based steel, bottom-up data on ore mining expansions hints at potential mismatches in the short term, risking supply constraints and cost volatility.
Key Message: A successful steel decarbonization push requires not only cleaner energy systems but also a well-planned, multi-decadal expansion of high-grade iron ore supply. Without that, the sector’s transition risks stalling or incurring higher costs, underscoring raw material quality as an often underappreciated yet vital driver of net-zero steel.
4.2 Clean energy availability and costs
Access to low-cost, low-carbon energy is essential for emerging steelmaking methods. While the costs of onshore wind and solar PV have dropped markedly in many regions, scaling hydrogen production to serve the steel sector introduces new challenges, including electrolyzer manufacturing capacity and the build-out of hydrogen infrastructure. Delivered costs for green hydrogen vary widely—spanning from about 2–4 USD/kg in resource-rich areas to more than 5 USD/kg where resources or infrastructure are limited. This range can translate into large differences in final steel prices, potentially impacting where and how hydrogen-based DRI-EAF is deployed.
Box 2: Energy as a Cornerstone for Steel Decarbonization—Cost Sensitivity, Regional Outlook, and Future Pathways
1. Evolving Energy Mix: Short vs. Long Term Perspectives
- Current Usage and Processes
- BF-BOF: Consumes ~20–24 GJ/t steel, with 70–80% of that energy from coal/coke (World Steel Association, Energy Use in Steelmaking). Electricity is a smaller fraction but rises under partial upgrades (e.g., BF gas injection, CCUS retrofits).
- EAF (Scrap): Requires ~8–12 GJ/t steel, primarily from electricity plus some natural gas. Cost and emissions hinge on grid carbon intensity and electricity pricing.
- DRI-EAF:
- Gas-Based: ~16–18 GJ/t steel, mostly from natural gas for iron ore reduction. Electricity is crucial for the EAF meltdown stage (~0.4–0.6 MWh/t).
- Hydrogen-Based: May require 2–3 MWh/t if H₂ is produced via electrolysis on-site or nearby. This massively increases the route’s sensitivity to electricity prices but can yield near-zero CO₂ if the grid is clean.
- Long-Term Decarbonization Goals
- IEA Net Zero by 2050 and Mission Possible Partnership foresee deep cuts in coal use, with EAF or advanced BF (with CCUS) dominating. In these pathways, electricity’s share of total energy for steel climbs, especially in hydrogen-based routes, provided grids decarbonize (<100–200 gCO₂/kWh) and power prices stay stable.
2. Micro vs. Macro: Top-Down vs. Bottom-Up Energy Dynamics
- Top-Down Scenarios
- Rapid renewables expansion lowers average power costs, enabling widespread EAF adoption or hydrogen-based DRI if policy frameworks penalize coal.
- By mid-century, net-zero pathways imply deep grid decarbonization plus stable industrial PPAs that could keep electricity at ~30–50 USD/MWh or less in resource-rich regions.
- Bottom-Up Realities
- Regional Electricity Prices: Often 40–120 USD/MWh. This range directly affects whether EAF or H₂ DRI is cost-competitive versus BF-BOF.
- Grid Carbon Intensities: Some major steel producers (China, India) still see >500 gCO₂/kWh, limiting near-term CO₂ benefits from EAF expansions. Meanwhile, the US and parts of the EU have cheaper, lower-carbon power that can encourage EAF growth.
- Permitting and Infrastructure: Renewables expansions are real but face grid integration hurdles. Industrial PPAs can help, but many plants remain cautious without robust carbon pricing.
3. Key Metrics: Energy’s Share of Steel Costs and Sensitivity
- Energy Cost Share
- BF-BOF: Energy (coal, coke, electricity) can be 20–30% of total production cost. A spike in coking coal price can significantly inflate BF-BOF steel costs.
- EAF (Scrap): Often 15–25% of costs are energy-related, mostly electricity. A 10 USD/MWh difference can shift final costs by ~4–8 USD/t, given typical power use of 0.4–0.6 MWh/t.
- DRI-EAF:
- Gas-based: Gas usage can be 30–50% of direct OPEX if prices fluctuate.
- H₂-based: With 2–3 MWh/t purchased electricity (electrolysis + meltdown), each 1 USD/MWh difference could raise steel costs by 2–3 USD/t—making stable, low-cost electricity essential for competitiveness.
- Real Cases
- Voestalpine (Austria), ArcelorMittal (Europe), US EAF Operators: All report that even a moderate power price swing (±10 USD/MWh) can shift EAF steel cost by ~5–10 USD/t. Over a multi-million-tonne output, that heavily influences site competitiveness.
- Gas Price Volatility: In gas-based DRI (Midrex, Energiron) or hybrid BF injection, doubling gas prices (e.g., 4→8 USD/MMBtu) can add 30–50 USD/t cost, overshadowing moderate changes in electricity.
4. Regional Outlook: Why US/EU Are Emphasized, and China’s Different Path
- US/EU Focus
- Both have large EAF shares (EU ~40–45%, US ~70%) and transparent power cost data. Policy measures like the EU ETS, CBAM, or US IRA shape near-term decarbonization. This clarity explains how a ±10 USD/MWh shift quickly becomes ±5–10 USD/t.
- China, India, Others
- China (~90% BF-BOF) and India rely heavily on coal-based processes. Electricity cost, though important for partial EAF growth, is less a deciding factor in the short term. Many major expansions or policy signals remain high-level, with fewer micro-level cost data.
- Over time, if carbon constraints tighten and grid decarbonization proceeds, these regions may adopt more EAF or DRI routes, but short-term shifts remain modest.
5. Future Pathways: Investor Confidence, Timelines, and Fuel Mix
- H₂ DRI-EAF vs. Gas-based DRI
- In a scenario where steelmakers fully rely on 2–3 MWh/t electricity for H₂ production and meltdown, cost sensitivity to power price soars. Without stable PPAs or cheap renewables, they risk uncompetitive steel.
- Gas-based DRI remains appealing in regions with cheap gas, but volatility or high carbon pricing may eventually push them toward hydrogen transitions.
- BF-BOF with CCUS
- Some integrated producers might retrofit BFs, capturing CO₂. While still using coal, robust CCUS infrastructure could reduce direct emissions. Electricity usage remains moderate, but project viability hinges on local CO₂ transport/storage and policy incentives.
- Investors’ Core Concern:
- Where electricity decarbonizes quickly—and if costs remain in the 30–50 USD/MWh band—EAF or H₂-based steel can thrive. In uncertain markets or high-power-price regions, BF-BOF or minimal gas-based retrofits remain the fallback.
- This multi-decadal timeline depends on each region’s ability to expand renewables, grid infrastructure, and energy storage or hydrogen logistics.
Conclusion: Energy Fundamentals Drive Steel’s Cost and Emissions Path
- Short-Term: Real data shows moderate expansions of EAF in the US/EU where electricity is relatively affordable and decarbonized. Coal-intensive routes dominate in China/India, partly due to cheaper local supply and less immediate cost pressure to shift.
- Long-Term: Net-zero pathways hinge on large-scale grid decarbonization and stable power prices. DRI-EAF with hydrogen could become a mainstay—but only if local policies and PPAs guarantee cost-competitive, low-carbon power. The difference between a 1 USD/MWh or 10 USD/MWh shift can multiply into multi-million-dollar annual impacts, shaping investment decisions.
- Overall: Whether through EAF-scrap, gas-based DRI, or H₂-based routes, energy remains the foundation of steel competitiveness and decarbonization. Regions that decarbonize electricity affordably can accelerate the transition, whereas those with expensive or high-carbon power may see slower adoption of low-carbon steel production methods.
Box 3: Making Sense of Hydrogen’s Role in Green Steel—Contrasting Ambitions with Current Realities

1. The Big Picture: Top-Down Scenarios vs. Actual Supply
- Hydrogen Demand Across Sectors
- IEA Net Zero by 2050 or similar pathways often project total low-carbon hydrogen use reaching 100 Mt/yr by mid-century, with around 50–60% of that coming from green routes (electrolysis) (IEA, Net Zero by 2050, 2021).
- Implication: If ~50–60 Mt of green H₂ is required globally, that means 2,500–3,000 TWh of renewable electricity—some 8–10% of today’s global electricity output (~29 PWh). If worldwide electricity demand grows to 55–80 PWh by 2050–2060, that fraction might drop to ~3–5%, which still represents an immense expansion of renewables.
- Steel’s Share
- Many top-down scenarios assume 15–20 Mt of hydrogen is allocated to steel. That implies ~750–1,000 TWh of renewable power—~2–3% of current electricity use (or ~1–2% if the global mix doubles).
- If we consider that hydrogen can produce ~25–30% of today’s new steel from ore (1.2 Gt) in a net-zero scenario, 70–75% of primary steel demand would still rely on other low-carbon or transitional routes (scrap-EAF, CCUS-equipped BF, advanced BF injection). Over the decades, expansions beyond 25–30% are possible, but require massive infrastructure and policy alignment.
- Reality Check
- Electrolyzer Manufacturing: Currently ~10–15 GW/yr capacity (BloombergNEF, 2023). Scaling to 50–60 Mt of green hydrogen by 2050 necessitates tens or hundreds of GW solely dedicated to steel—plus additional capacity for other sectors.
- Renewable Build-Out: Meeting steel’s portion alone may demand hundreds of gigawatts of wind/solar expansions; many regions face integration limits, supply chain bottlenecks, or slow permitting.
Despite top-down policy ambitions painting a plausible decarbonization pathway, current progress on electrolyzer expansions, project lead times, and financing constraints calls into question whether the steel sector can readily access all that hydrogen.
2. Bottom-Up Perspective: Deployment Pace and Real Cases
- Project Pipelines
- Current: Pilots and demonstration lines—e.g., HYBRIT in Sweden, H2 Green Steel, Salzgitter’s SALCOS, ArcelorMittal Hamburg—might collectively yield 10–15 Mt of hydrogen-based steel capacity by 2030 if all proceed (CRU, Steel Decarbonization Tracker, 2022). That’s under 2% of global steel output.
- H₂ Infrastructure: Large-scale hydrogen for steel typically needs brand-new electrolyzer capacity, dedicated renewables, plus transport/storage. Each step often takes 5–10 years from feasibility to commercial operation.
- Comparing Deployment Rates
- If low-carbon steel from hydrogen is to meet ~25–30% of current primary steel demand (~300–360 Mt) by 2050, we’d need tens of millions of tonnes of green H₂—plus expansions in ore quality, EAF capacity, and renewable power.
- Actual expansions to date indicate a slower ramp-up unless carbon policy, off-take agreements, or cost breakthroughs accelerate significantly. Many “announced” projects remain at MoU or feasibility stages, lacking final investment decisions (FIDs).
- Costs and Competitiveness
- Hydrogen still ranges 2.5–7 USD/kg in early projects, with high capital requirements for electrolyzers and guaranteed low-cost electricity. BF-BOF or gas-based DRI can be cheaper unless carbon pricing or “green steel premiums” close the gap.
- Some resource-rich areas (Middle East, southwestern US) might see near-term green hydrogen at ~2–3 USD/kg, but scale-up remains uncertain, and cross-sector competition may keep prices above conventional fuels.
3. Implications for Global Decarbonization Goals
- Relative Contribution
- Even if 15–20 Mt of hydrogen fuels 25–30% of today’s new steel from ore, that still leaves most primary steel reliant on either transitional or high-carbon routes unless parallel solutions like CCUS or advanced BF injection expand quickly.
- As steel demand grows (possibly +30% by 2050), hydrogen-based routes may need even greater volumes of H₂ to maintain the same share.
- Regions and Electricity Mix
- Where grid intensity exceeds 500 gCO₂/kWh, producing hydrogen from that electricity yields limited CO₂ savings. Conversely, regions with abundant renewable resources (Nordics, Middle East, parts of the US) have a clearer path to cost-effective green H₂ for steel.
- Policy and Market Levers
- Carbon Pricing or CBAM: A robust carbon price or border adjustment can make fossil-based routes less competitive, enabling hydrogen-based steel to scale.
- Offtake Contracts: Automakers, construction, or other end-users paying premiums for “green steel” can anchor stable investments in hydrogen supply chains.
- Global Competition: Faster-building hubs might capture “first mover” advantages, shaping steel trade flows as net-zero steel becomes more widely demanded.
4. Recalibrating Expectations
Using these real data points and pilot expansions:
- Meeting top-down H₂-based steel ambitions (~25–30% of the sector by mid-century) still demands far faster electrolyzer, renewable, and infrastructure development than we currently see.
- Bottom-up expansions remain modest, with a possible 10–15 Mt/yr hydrogen-based steel capacity by 2030 in advanced projects. If everything in the pipeline is realized, ~20–30 Mt is an upper bound—under 2% of global steel.
The gap between net-zero pathways and actual deployment reveals that while hydrogen is central to steel’s decarbonization, scaling it requires bridging formidable economic, technological, and policy hurdles.
5. Concluding View: Speed vs. Scale in Hydrogen Deployment for Steel
- Speed: Even achieving 25–30% hydrogen-based steel by 2050 demands an unprecedented scale-up. Real pilot data shows a decade of incremental expansions unless market or policy interventions become more aggressive.
- Scale: Producing 15–20 Mt H₂ for steel alone means thousands of TWh of low-carbon electricity plus a robust supply chain that doesn’t yet exist.
- Outlook: If the steel sector is to decarbonize rapidly with hydrogen, stakeholders must watch actual final investment decisions, construction of electrolyzer capacity, and the availability of high-grade ore. By contrasting top-down scenario targets with bottom-up expansions, we see that hydrogen’s potential is vast, but near-term progress remains incremental. Only accelerated policy and commercial momentum can close this gap and align the steel industry’s decarbonization with global climate objectives.
4.3 Evolving regulatory and policy frameworks
Carbon pricing, performance standards, and emissions trading schemes directly influence the economics of low-carbon steel. In some major markets, carbon prices already exceed 80–100 USD/tCO₂ and could climb higher by the 2030s, imposing an additional 150–250 USD/ton on conventional BF-BOF steel. Likewise, carbon border adjustments—such as the EU’s CBAM—promise to reshape international trade by levying carbon costs on imports, nudging exporting regions toward cleaner production routes. However, the scope and timing of these measures remain fluid, complicating strategic planning for steelmakers and investors.
4.4 Market dynamics, future costs, and technological breakthroughs
Long-term forecasts of steel demand, trade patterns, and key input costs (e.g., iron ore, scrap, electricity, hydrogen) involve numerous uncertainties. While emerging economies may propel future demand growth, mature markets could see demand stabilize or even contract, shifting global trade balances. Economic fluctuations, geopolitical tensions, and resource bottlenecks can spark price volatility—affecting margins and shaping the flow of capital into cleaner production technologies.
Technological progress further adds to this unpredictability. Breakthroughs in advanced ironmaking techniques, electrolyzer efficiency, or energy storage could significantly shift cost curves over the coming decades, introducing both risks and opportunities for manufacturers and policymakers.
Figure 4: Illustrating the impact of carbon pricing

Even moderate increases in carbon prices can narrow cost differentials between conventional BF-BOF and low-carbon steelmaking. For instance, baseline BF-BOF steel at 550 USD/ton with an emissions intensity of 2.0 tCO₂/ton would face costs exceeding 850 USD/ton if carbon prices hit 150 USD/tCO₂. Although this is a simplified scenario, it highlights the intertwined nature of carbon regulation, resource inputs, and technology development, all of which will steer the steel industry’s path to decarbonization.
5. Geopolitical and socio-economic implications
The steel industry’s shift toward low-carbon production stretches well beyond technological and cost considerations. Evolving supply chains, resource dynamics, labor market transformations, and public acceptance all factor into how regions compete, collaborate, or conflict in this new industrial era. Projections indicate that low-carbon steel could represent 10–15% of the global market by 2030 (IEA, 2020), but whether this transition proceeds smoothly or triggers volatility depends on resource distribution, technological capabilities, workforce readiness, and societal support.
5.1 Supply chain tensions and resource distribution
An increasing focus on high-grade iron ore for DRI and low-residual scrap for EAF production introduces fresh pressures across supply chains. Currently, just two countries—Australia and Brazil—account for over 60% of seaborne iron ore exports (World Steel Association, 2021; CRU, 2021). Any surge in demand for premium ore grades could exacerbate market concentration and price volatility. At the same time, green hydrogen and electrolyzer scale-up relies on critical minerals and specialized components, including platinum-group metals and advanced membranes—industries in which production is frequently geographically concentrated. China, for instance, leads in electrolyzer manufacturing and critical mineral processing (IEA, 2021).
Such supply chain constraints might intensify if governments prioritize resource security and domestic content requirements. The European Union’s strategy of enhancing “strategic autonomy” for hydrogen and low-carbon feedstocks (European Commission, 2021) could place exporters reliant on traditional raw materials at a disadvantage. Similarly, projects like HYBRIT in Sweden, which delivered its first fossil-free steel to Volvo in 2021 (HYBRIT, 2021), highlight how technological advancements and regional resource advantages can realign steel’s geographic footprint.
5.2 Technological competition and industrial leadership
Global competition is heating up to develop scalable, cost-competitive low-carbon steelmaking. The European Union’s Innovation Fund and expanded state aid for green investments aim to secure leadership in hydrogen-based DRI and CCUS-equipped BF-BOF retrofits (European Commission, 2022). China, meanwhile, targets a 30%+ reduction in steel-sector carbon intensity by 2030, leveraging its capacity for electrolyzer manufacturing and large-scale renewable deployment (CISA, 2021). In the United States, policy tools—such as tax credits and infrastructure programs—bolster investment in EAF modernization and hydrogen R&D (DOE, 2022).
These positioning moves unfold alongside carbon border adjustments (CBAMs) that could reshape international trade by imposing additional costs on high-emissions steel imports. Europe’s CBAM, slated for gradual implementation through the 2020s, may spur exporting countries to invest in low-carbon routes to retain market access (European Commission, 2021). Ultimately, the interplay between resource availability, regulatory structures, and technology adoption will determine which regions emerge as primary hubs of low-carbon steel production.
5.3 Employment, workforce skills, and retraining
Steel directly employs around 6 million people worldwide and indirectly supports millions more in related value chains (World Steel Association, 2021). Transitioning from BF-BOF to hydrogen- or EAF-based routes will demand new technical skills in process optimization, digital monitoring, hydrogen safety, and environmental compliance. In the European Union, industry associations estimate that 20–30% of the workforce could require retraining by the mid-2030s (EUROFER, 2020).
This need not cause widespread job losses if proactive steps are taken to upgrade skills and repurpose existing facilities. Integrated BF-BOF plants in coal-intensive regions face a steeper learning curve, yet multi-stakeholder efforts—from governments, unions, and industry associations—aim to manage the transition. Initiatives that include vocational training, certification, and targeted funding for workforce development can mitigate social disruptions while preserving regional competitiveness (ILO, 2022).
5.4 Social acceptability, communication, and eco-labelling
Public perception will play a pivotal role in accelerating or impeding low-carbon steel adoption. NGOs, consumer advocacy groups, and end-users are increasingly scrutinizing materials’ carbon footprints (Climate Group, 2021). Eco-labels and third-party certifications—such as those offered by ResponsibleSteel™—are becoming key instruments to validate and communicate the sustainability of steel products. By 2025, over 50 companies worldwide plan to adopt standardized life-cycle assessments and certification to differentiate low-carbon steel in the marketplace (ResponsibleSteel, 2022).
Yet, consumer willingness to absorb a “green premium” is still evolving. Surveys suggest that 20–30% of European consumers might pay more for products explicitly labeled as low-carbon steel, especially in high-visibility sectors like automotive and construction (BCG, 2021). Consistent messaging, transparent metrics, and predictable pricing will be critical to ensuring that public enthusiasm translates into stable demand. Over time, effective communication and supportive policy measures could create a self-reinforcing cycle that broadens the market for green steel and encourages deeper emissions reductions.
6. Case studies and concrete initiatives
Efforts to decarbonize steel production are no longer confined to theoretical analyses or small-scale pilots. Today, real projects, partnerships, and industrial-scale investments showcase both the feasibility and the complexity of transitioning to low-carbon steelmaking. In Europe, where energy costs, raw material dependencies, and regulatory frameworks intersect with intense global competition, these initiatives illuminate both the challenges and the strategic promise of a greener steel sector.
6.1 European pilot projects and industrial initiatives
Hybrit (sweden)
A partnership among SSAB, LKAB, and Vattenfall, the HYBRIT project aims to produce fossil-free steel by replacing the traditional BF-BOF route with hydrogen-based direct reduced iron (DRI) and electric arc furnaces (EAF) powered by renewable electricity. Since its pilot launch in 2020, HYBRIT has delivered small volumes of “fossil-free” steel to Volvo, achieving over 90% CO₂ reductions compared to coal-based methods. This aligns with previous analyses that estimate a 20–40% cost premium relative to conventional BF-BOF, tied mainly to the price of hydrogen and renewable power.
H2 green steel (sweden)
Another Swedish venture, H2 Green Steel, targets large-scale DRI-EAF production using green hydrogen, with an annual capacity goal of 5 Mt by 2030. Leveraging Sweden’s abundant renewables and high-grade iron ore, it aims to reach cost-competitive green steel within a decade—mirroring projections in earlier chapters that major cost declines are possible if electricity is sufficiently cheap (<30 USD/MWh) and electrolyzer technology scales up.
Salcos (germany)
Salzgitter’s SALCOS project centers on gradually phasing out BF-BOF capacity in favor of hydrogen-based DRI-EAF, seeking to cut CO₂ emissions by more than half in initial phases, then moving to near-zero carbon footprints in subsequent expansions. Germany’s robust R&D landscape and strong policy instruments—like carbon contracts for difference—offer critical support, underscoring how regional frameworks can accelerate investment in low-carbon steel routes.
Arcelormittal’s initiatives (multiple eu locations)
Europe’s largest steelmaker is implementing various low-carbon steel projects. Pilot-scale hydrogen-based DRI in Hamburg and planned EAF investments in Spain reflect a broader corporate strategy to transition away from coal-heavy BF-BOF. These moves parallel the estimates in previous chapters that see EAF-based steel (especially scrap-EAF or DRI-EAF) capturing a growing share of production if carbon pricing and renewable power availability align favorably.
Collectively, these projects highlight Europe’s push to blend leading-edge technology with regional advantages—such as renewables in Scandinavia and strong policy signals in Germany or the EU’s industrial heartlands.
6.2 Public-private partnerships, industrial alliances, and R&D programs
Europe has mobilized a range of policy and financial tools to advance steel decarbonization. The Clean Steel Partnership under Horizon Europe, for example, supports R&D and pilot-scale projects across the entire steel value chain. Funding mechanisms like the EU’s Innovation Fund help close the gap between laboratory successes and commercial-scale deployment, echoing earlier chapters’ emphasis on bridging technology readiness hurdles.
On the private side, alliances between steelmakers, electrolyzer manufacturers, and renewable energy providers continue to multiply. These arrangements often lock in long-term clean power purchase agreements or hydrogen supply contracts, stabilizing costs in the face of commodity price volatility. Industry bodies—including trade associations and multi-stakeholder platforms—further harmonize regulatory standards, life-cycle assessment methods, and certification schemes, aligning Europe’s ambitions with broader policy frameworks such as the Fit for 55 package and the Carbon Border Adjustment Mechanism.
6.3 Lessons from early deployments and commercial scale-up
While pilot results confirm that low-carbon processes can slash emissions by 80–90% or more, scaling them to millions of tonnes per year presents steep challenges. Early commercial deployments reveal persistent cost premiums of 20–50% over conventional steel, largely driven by hydrogen supply costs, electricity pricing, and the availability of DR-grade pellets. As noted in earlier discussions, effective policy support—carbon pricing, border adjustments, or contracts for difference—remains essential for narrowing these cost differentials.
Simultaneously, value chain coordination emerges as a critical success factor:
- Hydrogen must be procured under stable, multi-year agreements at predictable prices.
- Renewable power needs reliable infrastructure and high utilization to keep electricity costs low.
- DR-grade iron ore must be available in sufficient quality and volume to sustain consistent production.
- Equipment suppliers must be able to ramp up electrolyzer manufacturing and other specialized components.
Disruptions or bottlenecks in any one link of the chain could undermine the entire project’s economics, as emphasized in previous chapters dealing with supply constraints and uncertainties.
6.4 Strategic scenarios for the EU’s green steel supply chains
Table 3 below outlines four possible scenarios—spanning strong policy coordination with low-cost renewables to fragmented efforts and high energy prices. These scenarios draw on insights from prior chapters, demonstrating how raw material access, policy consistency, and technology deployment levels can lead to starkly different competitive outcomes for the EU.
Table 3. Key drivers and possible scenarios
| Parameters | Scenario A: “High Ambition, High Coordination” | Scenario B: “Selective Integration” | Scenario C: “Fragmented Effort, High Costs” | Scenario D: “External Reliance, Slow Progress” |
|---|---|---|---|---|
| Policy & Regulatory Alignment | Strong EU-wide coordination, robust carbon pricing >100 €/tCO₂, CBAM fully applied | Partial coordination; some member states lead, others lag; carbon price ~50–80 €/tCO₂ | Weak alignment; carbon price <50 €/tCO₂; fragmented national approaches | Minimal alignment; CBAM delayed; policy uncertainty persists |
| Energy & Hydrogen Prices | Low-cost renewables, large-scale electrolyzers (H₂ ~2 €/kg) | Moderate renewables scale-up, H₂ ~3–4 €/kg | High-cost renewables, H₂ >4 €/kg, bottlenecks reduce load factors | Limited renewable growth; heavy reliance on imported hydrogen at >4–5 €/kg |
| Raw Materials & Critical Inputs | Secured supply of DR-grade ore via long-term contracts; stable critical minerals | Mixed supply channels, partial reliance on spot markets | Chronic shortages of premium ores, competition with Asia | Dependency on external sources; no stable supply agreements |
| Cost Competitiveness vs. China/India | Near cost parity with Chinese green steel; stable hydrogen at ~2 €/kg supports competitiveness | Moderate premium (10–20%) over Chinese producers; some EU clusters remain viable | EU green steel is 30–50% more expensive; Asia leverages scale/cheaper renewables | EU steel uncompetitive; imports of cheaper low-carbon steel displace domestic production |
| Supply Chain Integration | Highly integrated with joint ventures, R&D, and stable long-term contracts | Partial integration; occasional supply disruptions | Disjointed supply chains; minimal R&D investment | Low integration; volatile markets and repeated bottlenecks |
| Likely Outcomes | EU emerges as a global leader, exporting technology, retaining industrial base | Moderate decarbonization; some leaders succeed, but reliance on imports persists | Slow decarbonization; reliance on retrofitted BF-BOF with CCUS; market share loss | Transition stalls, domestic production shrinks, EU becomes net importer of low-carbon steel |
Achieving the more optimistic paths (e.g., Scenario A) calls for concerted efforts to harmonize policy, deploy large-scale renewables and hydrogen, stabilize raw material access, and offer adequate financial incentives for low-carbon steel projects. Conversely, weaker coordination or continued dependence on external resources risks higher costs, slower decarbonization, and potential erosion of the EU’s industrial base.
By showcasing current pilots and mapping possible futures, Europe’s experience underscores the broader global challenge: how to balance technological ambition, resource constraints, policy alignment, and economic competitiveness to build a resilient, low-carbon steel sector.
Deep dive: How Electricity Price Impacts Hydrogen Cost (H₂ Cost Breakdown) and Steel Competitiveness
1. Why Hydrogen Cost Matters for Low-Carbon Steel
Hydrogen-based DRI-EAF routes can reduce steel’s direct CO₂ emissions by up to 90–95% (IEA, Energy Technology Perspectives, 2020). However, hydrogen’s high energy intensity (50–60 kWh per kg H₂ in electrolysis) makes electricity price a critical determinant of final H₂ costs. Because each tonne of H₂-based DRI steel typically needs ~50–60 kg of hydrogen, a small difference in H₂ cost (e.g., ±0.50 USD/kg) can swing steel production costs by ±25–30 USD/t. This deep dive breaks down each major cost component of green hydrogen, how it evolves, and how these changes can feed into (or hamper) low-carbon steel’s competitiveness.
2. H₂ Cost Structure: Four Main Components
- Electricity (Energy Input)
- Electrolyzer CAPEX (Capital Costs)
- OPEX (Excluding Power) and Maintenance
- Compression, Storage, or Liquefaction (If Needed)
Below is a typical breakdown for renewable electrolysis scenarios:
| Cost Component | Approximate Range (Current) | Key Drivers/Levers |
|---|---|---|
| Electricity | ~1.5–3.0 USD/kg H₂ | – PPAs at 30–70 USD/MWh – Load factor (utilization) |
| Electrolyzer CAPEX | ~0.5–2.0 USD/kg H₂ | – Installed cost (300–1000 USD/kW) – Financing & depreciation |
| OPEX (non-power) | ~0.2–0.5 USD/kg H₂ | – Water supply – Spare parts, labor, minor feedstock costs |
| Compression/Storage | ~0.1–0.3 USD/kg H₂ | – Depending on final pressure – Onsite vs. pipeline delivery |
These ranges reflect typical near-term or pilot-scale estimates. Large-scale economies or advanced technologies may push costs down further over the 2025–2035 horizon, while suboptimal conditions can raise them above these baselines.
2.1 Electricity Cost (Energy Input)
- Core Sensitivity: If an electrolyzer requires ~50 kWh per kg H₂ and the power price is 50 USD/MWh (i.e., 0.05 USD/kWh), the electricity portion alone is 2.50 USD/kg. A ±10 USD/MWh change (±0.01 USD/kWh) in power price shifts final H₂ cost by ±0.50 USD/kg.
- Load Factor Influence: The more hours per year the electrolyzer runs on cheap power, the lower the per-kg cost. Intermittent or expensive electricity raises cost. Some projects (e.g., Middle Eastern solar) aim for 4–5 USD cents/kWh with high utilization, targeting near 2 USD/kg H₂ eventually.
2.2 Electrolyzer CAPEX (Capital Costs)
- Installed Costs: Currently 300–1000 USD/kW, depending on technology (alkaline vs. PEM vs. SOEC), scale, and region (IEA, The Future of Hydrogen, 2019; BloombergNEF updates).
- Amortization: Spreading CAPEX over more operating hours lowers cost/kg H₂. High load factor or cheap capital reduces this portion. Conversely, if an electrolyzer runs half the time (intermittent renewables, no storage), CAPEX per kg rises significantly.
- Likely Trends: As global electrolyzer manufacturing scales (10–15 GW/yr now vs. <3 GW in 2020), unit costs could drop 30–50% by 2030 (Hydrogen Council, Global Hydrogen Flows, 2022). This implies CAPEX cost might fall from ~1.0–1.5 USD/kg H₂ to <0.5–1.0 USD/kg in prime cases.
2.3 OPEX (Excluding Power)
- Water Supply: Typically minor (~0.1–0.2 USD/kg H₂ in some places), but can be higher in water-scarce regions requiring desalination.
- Maintenance & Repairs: Ongoing maintenance for stacks, pumps, valves. Scale and design standardization can bring these costs down over time.
- Operational Labor: Automated large-scale plants need minimal direct labor, but smaller pilots or older designs may be more labor-intensive.
2.4 Compression, Storage, Liquefaction
- Final Delivery Requirements: DRI modules may need compressed H₂ at certain pressures, adding 0.1–0.2 USD/kg if onsite compression is required. If long-distance transport or liquefaction is involved, costs can climb further (0.3–0.5+ USD/kg).
- Integration with Steel Sites: Some integrated steel facilities might locate electrolyzers adjacent to the DRI module, minimizing transport costs. Others rely on pipeline or trucking, increasing complexity and cost.
3. Impact on Steel Competitiveness
- H₂ Requirement for Steel
- Each tonne of hydrogen-based DRI steel typically needs ~50–60 kg H₂. So if H₂ is 3 USD/kg, that alone adds 150–180 USD/t to steel production—plus the EAF meltdown electricity, pellet costs, labor, etc.
- Reducing H₂ cost from 3.0 to 2.0 USD/kg can slash steel cost by 50–60 USD/t, a massive competitiveness boost.
- Electricity-Price Amplification
- A 10 USD/MWh difference in electricity cost can shift H₂ cost by ±0.50 USD/kg. At 50–60 kg H₂/t, that’s ±25–30 USD/t steel. Such high sensitivity underscores the necessity of stable, low-cost power PPAs to justify billions in CAPEX for hydrogen-based steel.
- Future Outlook
- If electrolyzer CAPEX falls to <300 USD/kW, and large-scale renewables provide stable ~20–30 USD/MWh PPAs, green H₂ could near 1.5–2.0 USD/kg in top-tier locations by 2030–2035 (BloombergNEF). This might reduce the H₂ portion of steel cost to <100 USD/t, favorably competing with BF-BOF plus carbon pricing.
- However, many regions face permitting hurdles, grid integration issues, or remain reliant on higher-cost power, limiting near-term scale-up of hydrogen-based steel. Achieving net-zero ambitions depends on bridging this cost gap through policy, carbon pricing, or “green steel” premiums.
4. Technical and Policy Levers for Improvement
- Electrolyzer Advances
- Stack efficiency: from 50–55 kWh/kg down to ~45–50 kWh/kg.
- Durability and modular scale: bigger units => cheaper cost/kW.
- Digital/automation improvements reduce maintenance OPEX.
- Grid/Infrastructure Synergies
- Siting electrolyzers near steel plants, using curtailed renewables or dedicated PPAs, can boost load factors and reduce transport/compression.
- Policy support for large pipelines or H₂ storage hubs further lowers overhead per kg.
- Carbon Policy
- If BF-BOF faces high carbon taxes or CBAM, the cost gap with H₂-based steel narrows.
- Government-backed offtake agreements or “contracts for difference” can lock in stable revenues for green H₂, encouraging scale.
5. Concluding Case: Linking H₂ Costs Back to Steel
Bottom Line: The cost of hydrogen for steelmaking is essentially the cost of electricity times the electrolyzer efficiency, plus capital and operating overheads. Each step can pivot final steel costs by tens of USD per tonne. While top-down net-zero scenarios bank on sub-2 USD/kg H₂ by 2030–2040, real projects face uncertain grid expansions, partial policy incentives, and technology scale-ups that may only partially align with those ideals. Still, every incremental drop in H₂ cost can directly slash the premium for low-carbon steel, making hydrogen a linchpin for decarbonization—provided stable, cheap, and clean electricity can be secured at scale.
7. Recommendations and perspectives
Steel’s path to net-zero emissions requires more than piecemeal innovation. At stake is a global race where the real competition is between human societies—striving to maintain economic and social well-being—and the threat of unchecked climate change. Achieving deep decarbonization in steelmaking means bridging the gap between local bottom-up dynamics (where projects often proceed incrementally) and globally coordinated, policy-driven objectives (such as those in the IEA’s Net Zero Emissions or Sustainable Development Scenarios). Below is a concise set of recommendations and perspectives highlighting how to accelerate this transition at scale.
7.1 Policy levers: incentives, standards, and global cooperation
- Financial incentives and carbon pricing
- Front-loaded subsidies (e.g., EU Innovation Fund, US tax credits) can lower early project risks and reduce cost premiums for low-carbon steel by 20–40% (IEA, 2020; Mission Possible Partnership, 2021).
- Robust carbon pricing (>80–100 USD/tCO₂) narrows the cost gap between green and conventional steel, especially if coupled with carbon border mechanisms that curb leakage (European Commission, 2021).
- Standards, certification, and shared metrics
- Harmonized “green steel” standards and life-cycle assessment protocols let buyers identify and reward truly low-carbon products.
- Initiatives such as ResponsibleSteel™ strengthen market pull, stimulating investment in cleaner processes (Climate Group, 2021).
- International partnerships and trade frameworks
- Collaborative platforms (G20, Clean Energy Ministerial) can coordinate technology transfer, stabilize supply chains, and pool R&D resources—essential given the scale of hydrogen, CCUS, and advanced material needs.
- Regional alliances (e.g., North African renewable hubs supplying Europe) can help secure cost-competitive green hydrogen, easing raw material and energy bottlenecks (IRENA, 2021).
7.2 Corporate strategies: innovation, integration, and value-chain collaboration
- Technology adoption and R&D
- Firms investing 3–5% of annual CAPEX in low-carbon pilots and knowledge-sharing alliances gain a head start as carbon constraints tighten (BloombergNEF, 2022).
- Early movers in hydrogen-based DRI and CCUS retrofits can shape new trade flows and build brand advantages.
- Vertical integration and supply security
- Securing DR-grade iron ore, electrolyzer-critical minerals, and renewable power reduces cost volatility.
- Upstream/downstream integration—from mining to energy procurement—can mitigate supply chain disruptions (Wood Mackenzie, 2021).
- Long-term contracts and risk-sharing
- Stable offtake agreements with key customers ensure a market for low-carbon steel at a predictable price floor.
- Joint procurement of electrolyzers or renewable PPAs fosters scale economies, lowering input costs (Mission Possible Partnership, 2021).
7.3 From bottom-up initiatives to global climate alignment
- Early adoption (2025–2030)
- Scale existing pilots (HYBRIT, SALCOS, ArcelorMittal’s Hamburg) toward semi-commercial facilities producing 1–2 Mt of low-carbon steel annually.
- Solidify carbon markets so that prices exceed 50–80 USD/tCO₂ in major steel regions, creating investment certainty.
- Rapid expansion (2030–2040)
- Grow DRI-EAF capacity by tens of millions of tonnes globally, backed by maturing hydrogen and CCUS infrastructure.
- Halve electrolyzer CAPEX to enable hydrogen prices approaching 2–3 USD/kg, pushing low-carbon steel toward cost parity in advanced markets.
- Consolidation and near-net-zero (2040–2050)
- Scale up 25–30 major low-carbon steel hubs worldwide, each exceeding 5 Mt annual production.
- Achieve near-parity or cheaper low-carbon steel in multiple regions as carbon prices stabilize above 100 USD/tCO₂ and hydrogen supply chains mature.
7.4 Real vs. ideal decarbonization: closing the ambition gap
Today’s bottom-up efforts—driven by pilot projects, localized policies, and partial supply chain agreements—remain insufficient to bend the steel sector’s emissions curve in line with climate stabilization goals. Even if incremental improvements boost the share of low-carbon steel to 10–20% by mid-century, absolute emissions could remain above 3 GtCO₂/year, far from net-zero pathways (World Steel Association; IEA).
In contrast, ambitious global scenarios (e.g., IEA NZE or SDS) call for 60–70% low-carbon steel by 2050, anchored by strong carbon pricing, large-scale hydrogen infrastructure, robust CCUS networks, and aggressive recycling or material efficiency measures. Achieving this level of decarbonization demands worldwide coordination to overcome technology cost premiums and raw material constraints.
Key takeaway: Surpassing narrow corporate or national priorities is imperative. The steel industry must recognize that the true race is not steelmaker vs. steelmaker, but humanity vs. climate change. Accelerating decarbonization on a globally coordinated scale—backed by credible policy signals, supply chain partnerships, and shared innovation—offers the most viable path to safeguard both economic vitality and the planet’s climate stability.
Box 4: Bridging bottom-up trends with ambitious climate scenarios

Achieving net-zero emissions in steel demands reconciling real-world, bottom-up developments—where pilot projects and incremental investments shape near-term capacity—with top-down targets such as the IEA Net Zero Emissions (NZE) or Sustainable Development Scenarios (SDS), which envision rapid, large-scale transformation. This box expands on the data sources and reasoning behind these two perspectives, illustrating why current trajectories risk falling short of climate objectives—and what it would take to close the gap.
1. Data sources and approach
- Historical baseline (2020–2025)
- Global steel output: ~1,865 Mt/year, with direct emissions at ~3 GtCO₂/year (World Steel Association, IEA).
- Technology mix: ~70% BF-BOF, ~24.5% scrap-based EAF, and ~5.5% gas-based DRI-EAF. Fewer than 1% of facilities operate low-carbon methods at scale (e.g., hydrogen-based DRI, CCUS-equipped BF-BOF).
- Project pipeline for low-carbon steel
- Pilot and demonstration sites: Public announcements (e.g., HYBRIT, H2 Green Steel, SALCOS) account for ~2–5 Mt of planned low-carbon capacity by 2025.
- Scaling assumptions: We tracked each project’s nominal capacity, typical ramp-up rates (2–4 years after commissioning), and the likelihood of full investment. Only about half of these early initiatives are expected to reach stable production before 2030, given financing and technology risks.
- Ambitious scenarios (nze/sds)
- IEA Net Zero Emissions (NZE) / Sustainable Development Scenarios (SDS): Target a 1.5–2 °C climate pathway via strict carbon pricing (~100 USD/tCO₂ or more), abundant renewables, large-scale hydrogen, robust CCUS networks, and strong policy coordination.
- Assumed technology deployment: NZE/SDS sees DRI-EAF and CCUS capturing a significant share (up to 30–40% by 2040) and eventually 60–70%+ by 2050, driving emissions down toward near-zero.
2. Bottom-up scenario: from pilots to moderate scale-up
- Near-term (by 2030)
- Likely outcome: Only ~3–5% of global steel capacity may shift to hydrogen-based DRI or CCUS-equipped BF-BOF, given the limited project pipeline and uneven policy frameworks.
- Emissions implication: Demand growth—particularly in emerging economies—could raise total annual steel production to ~2,100–2,200 Mt, pushing absolute emissions up slightly (3.2–3.4 GtCO₂) despite incremental efficiency gains.
- Medium-term (2030–2040)
- Replication of successful pilots: Each operational low-carbon plant may inspire 2–3 follow-on facilities, aided by partial declines in hydrogen and electrolyzer costs.
- Supply constraints: Availability of high-grade iron ore pellets and stable, low-cost electricity/hydrogen remain bottlenecks, especially without uniformly high carbon prices.
- Estimated outcome: Low-carbon steel might approach ~8–12% of global output; emissions stay near or slightly above 3.4 GtCO₂/year, as conventional BF-BOF still dominates.
- Long-term (2040–2050)
- Incremental improvements: Even if hydrogen and CCUS costs fall further, slow adoption, uneven infrastructure, and regional policy disparities constrain widespread deployment.
- Bottom-up projection: ~10–20% low-carbon share worldwide, leaving absolute emissions at or above ~3 GtCO₂/year—a modest drop from current levels but far from net-zero.
3. Bridging the gap: NZE/SDS perspective
- Accelerated policy and infrastructure
- NZE/SDS models assume robust carbon pricing (>100 USD/tCO₂), enabling near-cost parity between green and conventional steel by the 2040s.
- Large-scale electrolyzer manufacturing (hundreds of GW), CCUS hubs, and integrated resource planning (e.g., dedicated green-hydrogen corridors) support a rapid shift away from coal.
- Decoupling emissions from demand
- Even if global steel demand hovers around ~2,200 Mt by 2040, NZE/SDS pathways aim for 30–40% of production via hydrogen-based DRI or CCUS by then—shrinking sectoral emissions to ~1.5–1.8 GtCO₂/year.
- By 2050, near-zero steel (60–70% or more) becomes mainstream, bringing emissions below 1 GtCO₂/year.
- Circular economy and resource efficiency
- NZE/SDS places strong emphasis on scrap recycling, product longevity, and material substitution, easing the burden on primary steel production.
- More advanced EAF-based processes—powered by low-carbon grids—further cut net emissions, reinforcing a virtuous cycle where less virgin ore and fewer carbon-intensive processes are required.
4. Figure: comparing bottom-up vs. ambitious scenarios

Note: All percentages and absolute emissions (GtCO₂) in this chart are indicative ranges drawn from various scenario analyses (IEA, Mission Possible Partnership, World Steel Association) and current pilot project announcements. They serve to highlight the directional gap between a “bottom-up” trajectory and more ambitious net-zero or SDS pathways.
Key assumptions and clarifications:
- Partial Decarbonization of ‘Non-Low-Carbon’ Capacity
- Even if only half of production is labeled “fully low-carbon” (e.g., hydrogen-based DRI-EAF or 90%+ CCUS), the remaining capacity is not simply continuing unabated at today’s emission levels.
- Many scenarios assume incremental retrofits (lower coke rates, partial CCUS, moderate grid decarbonization) that significantly reduce emissions from legacy BF–BOF and EAF plants, without qualifying them as “fully low-carbon.”
- Demand-Side Changes and Efficiency
- Reductions in total steel demand—via higher recycling rates, design improvements, and longer product lifespans—can lower absolute emissions, even if the share of strictly “green” facilities is under 50%.
- A higher scrap supply also improves the emissions profile for EAF routes, further bridging the gap.
- Offsets and Negative Emissions
- Some net-zero roadmaps incorporate bioenergy with CCS, direct air capture, or land-use changes to compensate for remaining CO₂, effectively allowing sector-wide net-zero despite a mix of “fully” and “partially” decarbonized capacities.
- Illustrative Purpose
- These figures are approximate and reflect varied assumptions (technical readiness, policy support, infrastructure lead times, cost trajectories). Actual outcomes will differ by region, timeframe, and how effectively multiple levers—partial CCUS, efficiency gains, grid decarbonization, and offsets—are combined in practice.
5. Key insights
- The ambition gap
- Under business-as-usual or mildly improved conditions, low-carbon steel could remain a niche (10–20% by 2050), leaving emissions stubbornly high (~3 GtCO₂/yr).
- NZE/SDS targets demand a substantially faster scale-up (60–70%) to push emissions below 1 GtCO₂/yr by mid-century.
- Policy and finance as accelerators
- Carbon pricing, border adjustments, and bold incentives for hydrogen and CCUS can mobilize the capital and infrastructure needed for large-scale adoption.
- Without these measures, technology cost premiums and supply chain bottlenecks slow the transition.
- International collaboration
- Coordinated efforts—across mining (high-grade ore), renewable energy expansion, electrolyzer manufacturing, and CCUS infrastructure—are essential to scale low-carbon steel.
- The sector’s global nature demands harmonized standards and policies to avoid regional “carbon havens” and ensure broad-based emissions reductions.
6. Concluding perspective
This box illustrates how a bottom-up assessment of real-world projects paints a picture of incremental progress, while NZE/SDS trajectories reflect the scale of transformation required to limit warming to 1.5–2 °C. Bridging these two visions calls for decisive policy action, robust financing, and cross-border coordination to ensure that today’s pilots can grow into a global, near-net-zero steel ecosystem by mid-century.
8 Conclusion

Decarbonizing the steel sector stands among the most pressing challenges in global climate action. As this analysis illustrates, the journey from today’s mostly coal-based industry to the advanced, low-carbon pathways of tomorrow hinges on three critical factors: technological readiness, policy resolve, and market coordination.
On the technology front, hydrogen-based direct reduction, CCUS retrofits, and optimized scrap-EAF processes all have the potential to drastically cut emissions. Yet each route requires sustained investment, resilient supply chains (e.g., high-grade iron ore, critical minerals for electrolyzers), and supportive infrastructure (renewable electricity, CO₂ transport and storage).
Policy signals—particularly carbon pricing above 80–100 USD/tCO₂, border adjustments, and targeted incentives—are vital to tipping the economics in favor of low-carbon steel. Clear standards and certifications can further spur market demand by distinguishing “green steel” in global value chains. Meanwhile, cooperation among governments, industry, and financiers can unlock scale economies, share R&D risks, and accelerate technology diffusion across regions.
Finally, the steel sector’s decarbonization trajectory must align with global climate goals to meaningfully limit warming to 1.5–2 °C. Although near-term pilot projects and incremental improvements are encouraging, they currently fall short of the rapid transformation envisioned by net-zero scenarios. Closing this gap will require a bold commitment: embracing robust policy frameworks, allocating capital toward scalable low-carbon solutions, and mobilizing international collaboration.
In short, the true competition is not steelmaker versus steelmaker; it is humanity versus climate change. The faster and more decisively the steel industry pursues deep decarbonization, the greater the chance of safeguarding economic development, social well-being, and a stable climate for future generations.
References
International Energy Agency (IEA)
- Offers technology roadmaps, scenario analyses (including net-zero pathways), and sector-specific publications on decarbonizing steel.
- https://www.iea.org/
Intergovernmental Panel on Climate Change (IPCC)
- Publishes comprehensive climate science assessments, emissions scenarios, and mitigation reports applicable to heavy industries like steel.
- https://www.ipcc.ch/
World Steel Association (worldsteel)
- Provides annual statistics on global steel production, market outlooks, and research on technological trends shaping the industry.
- https://worldsteel.org
European Commission (EU)
- Source of policy initiatives, including the Carbon Border Adjustment Mechanism (CBAM) and innovation funding relevant to low-carbon steel.
- https://ec.europa.eu/
ArcelorMittal
- Corporate press releases, pilot project updates (e.g., hydrogen-based steelmaking), and sustainability reports on decarbonization strategies.
- https://corporate.arcelormittal.com/
Mission Possible Partnership (MPP)
- Industry-led platform offering sector transition strategies, including net-zero roadmaps for steel and other energy-intensive industries.
- https://missionpossiblepartnership.org
BloombergNEF (BNEF)
- Provides analytical insights, cost trends, and deployment data on renewables, hydrogen, CCUS, and other decarbonization technologies.
- https://about.bnef.com/
CRU Group
- Research and consultancy covering steel market dynamics, raw material pricing, and supply chain shifts relevant to low-carbon steel.
- https://www.crugroup.com/
Other Advisory Groups and Associations
- Various organizations (e.g., EUROFER, OECD, ILO) and consulting firms (e.g., McKinsey, Bain) also publish valuable analyses on steel’s transition pathways, workforce impacts, and global policy trends.
Note: The article cites additional corporate reports, academic studies, and pilot project updates beyond these primary sources. For specific data or scenario figures, please consult the official portals and archives of each organization.
